Why Flowchart From Code Changes Everything
Generating a flowchart from code significantly changes how development teams understand and discuss software projects. It creates a bridge between complex, often difficult-to-understand codebases and clear, visual representations of how a program works. This shift has major implications for team collaboration, project documentation, and even the software development lifecycle itself.
Enhanced Communication and Collaboration
Explaining complex code logic to non-technical stakeholders can be challenging. Flowcharts offer a universally accessible visual language. This shared understanding improves communication between developers, project managers, and clients, ensuring everyone is on the same page. For instance, presenting a visual flowchart of a user login process is far clearer than pages of code.
Streamlined Documentation
Manually creating and updating documentation, especially diagrams, is a time-consuming and error-prone process. In fast-paced development environments, documentation quickly becomes outdated. Automatically generating flowcharts from the code solves this problem. The diagrams stay synchronized with the codebase, providing accurate, up-to-date documentation effortlessly. The history of flowcharts dates back to 1921 with Frank and Lillian Gilbreth, creators of "Process Flow Charts" to analyze workflows. Their goal was to improve efficiency, much like today. Learn more about the history of flowcharts here: https://tettra.com/article/flowcharts/
Accelerated Debugging and Onboarding
Flowcharts generated from code aren't just for external communication; they're powerful developer tools. Visualizing code pathways simplifies debugging by allowing developers to quickly spot logic errors and potential bottlenecks. Flowcharts are also a great onboarding resource for new team members. They can understand project architecture and logic much faster with a visual guide than by reading thousands of lines of code. This faster onboarding leads to improved productivity and quicker project completion.
Improved Code Quality and Maintainability
By visualizing the code's structure, flowcharts can highlight complex areas or potential problems in the code. This awareness can lead to improved code design choices and higher overall code quality. Moreover, well-documented code, supported by visual flowcharts, is inherently easier to maintain. Developers can understand and modify existing code confidently, reducing the risk of bugs and speeding up the development process. Teams can iterate faster and deliver new features more efficiently. The ability to quickly create flowcharts from code is a crucial advantage for software teams prioritizing speed and clarity.
Battle-Tested Tools That Actually Work

Creating flowcharts from code can be daunting. The sheer number of available tools can make the selection process overwhelming. However, by focusing on tools proven in real-world projects, you can simplify your decision. This means looking at platforms that consistently deliver for experienced developers. Let's explore some of the leading contenders in the flowchart generation space.
Lucidchart: Enterprise-Grade Features
Lucidchart offers a robust set of features specifically designed for enterprise-level diagramming. Its collaborative features, such as real-time co-editing and comprehensive version control, make it ideal for larger teams. Lucidchart also integrates seamlessly with popular platforms like Google Workspace and Microsoft Teams, streamlining workflows.
Draw.io: The Developer Favorite
Draw.io (now diagrams.net) is a popular choice among developers. This is largely thanks to its open-source nature, intuitive interface, and flexible deployment options. It offers both cloud-based and self-hosted versions. Its simplicity and extensive library of shapes and templates make it easy to create professional diagrams quickly, which contributes to its widespread adoption. For further insights into code visualization, check out this resource: How to master code visualization tools.
Specialized Tools For Specific Languages
Beyond general-purpose tools, there are specialized platforms tailored to specific programming languages. These tools often provide deeper code analysis and more specific diagram generation. For instance, some excel at visualizing object-oriented structures in Java or parsing complex control flow in Python. This language-specific approach allows for more precise visual representations of code logic.
Choosing The Right Tool For Your Needs
The best flowchart generation tool for you depends on several factors. These include budget, required integrations, and supported programming languages. Lucidchart offers powerful enterprise-grade features. However, Draw.io provides a free and flexible alternative. Specialized tools cater to specific language requirements. Carefully evaluate your team's needs before making a decision.
To help you compare, we've compiled a table summarizing the key features of the tools discussed:
Leading Flowchart Generation Tools Compared Real-world comparison of automated flowchart tools including performance, pricing, and developer satisfaction ratings
| Tool Name | Supported Languages | Pricing Model | Key Strengths | Best Use Cases |
|---|---|---|---|---|
| Lucidchart | Various | Subscription | Enterprise features, collaboration, integrations | Large teams, complex diagrams, professional documentation |
| diagrams.net | Various | Free/Subscription | Open-source, intuitive, flexible deployment options | Individual developers, small teams, quick prototyping |
| Specialized Tools | Language-specific | Varies | Deep code analysis, tailored diagrams | Projects requiring language-specific visualization |
This table highlights the strengths of each tool, allowing you to quickly identify the best fit for your project. Choosing the right tool can significantly impact your workflow and the quality of your flowcharts.
By considering these factors and exploring the available options, you can find the ideal tool to transform your code into clear, actionable flowcharts.
Your Step-By-Step Implementation Roadmap
Transforming code into a flowchart is a straightforward, yet powerful process. It generally involves three key steps: inputting your code, parsing the syntax, and generating the flowchart. 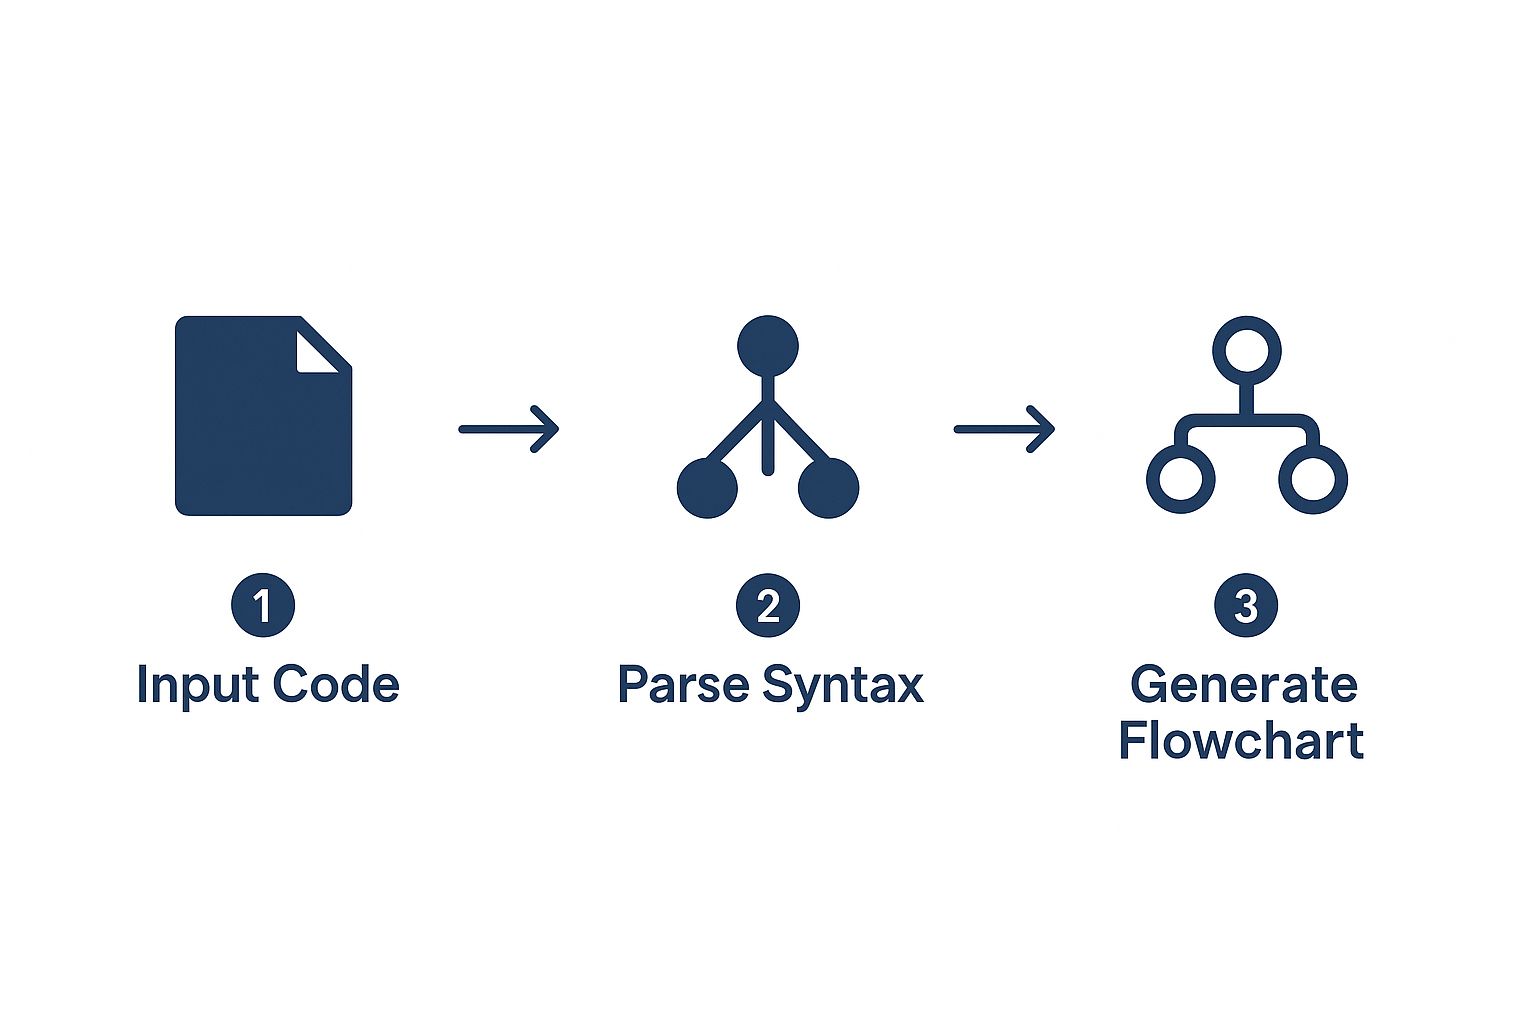 This simplified representation illustrates the core functionality of most flowchart-from-code generators. Breaking down the process into these distinct stages helps developers better understand how these tools analyze and visualize complex code structures. To enhance your flowcharts visually, consider tools that automate video creation. A helpful resource is this list of AI video generators.
Preparing Your Code
Before generating a flowchart, ensure your code is well-structured and clearly commented. This preparation is crucial for producing accurate and readable flowcharts. For example, consistent indentation and meaningful variable names significantly improve a parser's ability to understand the code's structure.
In addition, comments within your code can serve as annotations within the generated flowchart. This provides valuable context for both technical and non-technical audiences.
Choosing the Right Tool
Selecting the right tool is another key step. Many platforms offer flowchart-from-code generation, each with its own strengths and weaknesses. Some tools excel at handling specific programming languages, such as Python or Java. Others are more versatile and may integrate with development tools like Git.
Choosing the right tool depends on your project requirements and team preferences.
Handling Complex Structures
Modern code often involves complex structures like nested loops and conditional statements. Understanding how your chosen tool handles these intricacies is essential.
Some tools might simplify complex structures for clarity. Others strive for a detailed, albeit potentially more complex, representation. This impacts how accurately the flowchart reflects your underlying code logic.
Fine-Tuning and Customization
After generating the initial flowchart, fine-tuning the output is often necessary. This might involve adjusting the layout, adding custom labels, or highlighting specific code paths.
Many tools offer customization options, allowing you to control the level of detail. This lets you tailor visualizations for different audiences, from high-level overviews to in-depth technical analyses.
Integrating into Workflow
Finally, consider how flowchart generation fits into your development workflow. Successful teams often integrate these tools into existing processes. For instance, they might automate flowchart creation during builds or code reviews.
This integration keeps flowcharts up-to-date and ensures they actively contribute to documentation and understanding, preventing them from becoming a separate, neglected artifact.
Mastering Data Flow Diagrams For System Design
While traditional flowcharts generated from code illustrate program logic, Data Flow Diagrams (DFDs) offer a higher-level perspective on how information travels through a system. This broader view is often more useful for system design and for communicating with non-technical stakeholders. Understanding data flow is essential for effective system architecture. Once you've grasped the basics, you might be interested in exploring how to implement AI in business.
When DFDs Shine
DFDs are excellent at revealing the "big picture" of data transformation within a system. They're less focused on the specific code execution steps shown in a traditional flowchart and more concerned with data origins, modifications, and storage locations. This makes them particularly valuable for:
- System Analysis: Pinpointing bottlenecks and inefficiencies in data processing.
- Business Process Documentation: Clearly visualizing how data supports business operations.
- Stakeholder Communication: Explaining complex systems to those without a technical background.
Building Multi-Level DFDs
DFDs can be created with varying levels of detail. A Level 0 DFD, also called a context diagram, provides a high-level overview of the entire system and its interaction with external entities. Subsequent levels, like Level 1 and Level 2, break the system down into smaller processes, revealing increasingly granular data flows. This hierarchical method allows you to manage complexity without overwhelming the viewer.

Data Flow Patterns and System Architecture
Analyzing data flow patterns revealed by DFDs can inform important system architecture choices. For example, identifying tightly coupled components might suggest areas for decoupling to improve modularity. Recognizing redundant data flows can highlight opportunities for optimization and simplification. Data Flow Diagrams (DFDs) originated in the late 1970s, popularized by Yourdon and Constantine's book Structured Design. Unlike basic flowcharts, DFDs use specific symbols to represent data's journey within a system. You can learn more about Data Flow Diagrams.
Practical Applications of DFDs
Consider designing an e-commerce platform. A Level 0 DFD might show the system interacting with customers, payment gateways, and inventory databases. A Level 1 DFD would then decompose the system into processes like "Order Processing," "Payment Authorization," and "Inventory Management," illustrating the data flow between them. This layered approach provides clarity for all stakeholders.
By mastering DFDs, you acquire a powerful tool for system design, documentation, and communication. They complement traditional code-generated flowcharts by providing a crucial high-level view of data transformation within your system. This understanding is essential for building efficient and robust software architectures.
Handling Complex Code Like A Pro

Modern codebases often utilize intricate structures. These can include object-oriented patterns, recursive functions, and asynchronous operations. Generating a flowchart from code with these complexities requires a more strategic approach than simple visualization. This section explores techniques to effectively visualize complex programming concepts, creating understandable flowcharts.
Visualizing Inheritance Hierarchies
Object-oriented programming relies heavily on inheritance. Visualizing these relationships clearly in a flowchart is crucial for understanding your application’s structure. Tools like Lucidchart offer specialized shapes and connectors to represent inheritance. This makes depicting complex class hierarchies easier and simplifies understanding the relationships between different classes.
Representing Asynchronous Operations
Asynchronous programming is essential for responsive applications, but it introduces complexities in code flow. Clearly depicting these non-linear execution paths in a flowchart requires specific techniques. Consider using distinct visual cues, such as different arrow styles or colors, to differentiate asynchronous operations from synchronous ones. This helps viewers quickly identify the flow of asynchronous processes.
Breaking Down Monolithic Functions
Large, monolithic functions can produce unwieldy flowcharts. Breaking these functions down into smaller, more manageable components is key. Many flowchart generation tools allow selectively visualizing portions of your code. This targeted approach enables creating focused diagrams for individual functions or code blocks, improving clarity.
Notation Strategies for Design Patterns
Modern applications often use established design patterns. Representing these patterns effectively in a flowchart enhances communication among developers. Adopting standardized notations for common design patterns, like the Singleton or Factory pattern, can significantly improve diagram readability. This consistent visual language simplifies understanding complex code structures.
Documenting Enterprise-Scale Applications
Generating flowcharts for large-scale applications requires special considerations. Breaking down the application into smaller, logical modules and generating separate diagrams for each can be beneficial. This modular approach allows developers to navigate and understand specific areas of the codebase without being overwhelmed by a single, massive flowchart. This makes documentation more manageable and the diagrams more useful.
Solving Real-World Implementation Challenges
Generating flowcharts from code offers significant advantages, but implementation isn't always straightforward. Development teams frequently encounter obstacles that can hinder the process. This section addresses common challenges and proposes practical solutions. You might be interested in how to master software development automation for further streamlining your workflow.
Legacy Code and Visualization Resistance
Legacy code, often characterized by a lack of clear structure and documentation, can be difficult to visualize effectively. This can result in inaccurate or incomplete flowcharts.
The solution lies in improving the code's readability before visualization. Techniques like refactoring, adding comments, and applying consistent formatting can make a significant difference. This pre-processing step prepares the code for optimal flowchart generation.
Spaghetti Code and Meaningless Diagrams
Spaghetti code, notorious for its tangled and convoluted logic, presents a unique challenge. Generating flowcharts directly from such code can produce equally confusing diagrams, diminishing their value.
Strategies such as identifying key code paths and isolating core logic can significantly improve the resulting visualizations. This focused approach prioritizes generating flowcharts that provide valuable insights.
Performance Issues with Large Codebases
Processing extensive codebases to generate flowcharts can create performance bottlenecks. Some tools may struggle to handle large volumes of code efficiently.
The solution is to use tools optimized for large projects or to adopt a modular approach. Generating flowcharts for individual modules, rather than the entire codebase at once, can significantly improve performance. Furthermore, tools with robust parsing capabilities can manage large files without performance degradation.
Maintaining Accuracy as Code Evolves
Keeping flowcharts up-to-date as code evolves can be a considerable burden. Manual updates are time-consuming and flowcharts can quickly become outdated, losing their value as accurate documentation.
Automating flowchart generation offers a practical solution. Integrating flowchart creation into the development workflow ensures diagrams are updated alongside the code. Tools that automatically generate flowcharts during builds or code reviews contribute to maintaining current documentation.
Integrating Visual Documentation into Workflows
Integrating visual documentation into existing development workflows is essential for long-term success. This involves addressing workflow disruptions and encouraging team adoption.
Practical strategies include establishing coding standards that support clean diagram generation, educating teams on the benefits of flowcharts, and integrating flowchart creation into continuous deployment/continuous integration (CI/CD) pipelines. This holistic approach ensures flowcharts become a core part of the development process, not just a separate artifact. Consider tools that simplify the integration of visual documentation and provide seamless workflows for creating and managing diagrams.
To illustrate some of these challenges and their solutions, take a look at the table below:
Common Implementation Challenges And Proven Solutions describes real problems development teams face with flowchart generation and actionable solutions from experienced practitioners.
| Challenge | Impact On Team | Proven Solution | Prevention Strategy |
|---|---|---|---|
| Legacy Code | Inaccurate, incomplete flowcharts | Refactor, comment, and format code before visualization | Establish coding standards and regular code reviews |
| Spaghetti Code | Confusing, meaningless diagrams | Isolate core logic, identify key code paths | Modular code design, avoid overly complex functions |
| Large Codebase Performance | Slow generation, resource intensive | Modular approach, use optimized tools | Efficient parsing algorithms, distributed processing |
| Maintaining Accuracy | Outdated flowcharts, manual updates | Automate flowchart generation during builds/reviews | Integrate with version control, automated documentation |
| Workflow Integration | Disruptions, low team adoption | Coding standards, training, CI/CD integration | Choose tools with seamless workflow integrations |
As this table demonstrates, addressing these common challenges requires a multifaceted approach. By combining proactive prevention strategies with practical solutions, development teams can successfully integrate flowchart generation into their workflow and reap the benefits of clear, accurate, and maintainable visual documentation.
Key Takeaways For Long-Term Success
Generating flowcharts from code shouldn't be a one-off experiment. To truly benefit, integrate this powerful technique into your development workflow for a lasting impact. This involves establishing best practices, fostering team buy-in, and adapting your processes. This final section provides a roadmap for long-term success with automated flowchart generation.
Establishing Coding Standards For Better Diagrams
The quality of your flowcharts is directly related to the quality of your code. Clean, well-structured code with descriptive variable and function names produces easier-to-understand diagrams. Implementing coding standards that emphasize readability and consistency is crucial.
For example, consistent indentation, meaningful comments, and avoiding "spaghetti code" greatly improve the accuracy and clarity of generated flowcharts. Learn more in our article about how to master code quality metrics.
Team Training and Buy-In
Introducing any new tool requires team training and fostering a sense of value. Educate your team on the benefits of using flowcharts. These include improved communication, faster onboarding, and reduced debugging time.
Practical workshops and clear documentation can greatly facilitate adoption. Demonstrating how flowcharts simplify complex tasks and improve team collaboration encourages active usage.
Integrating With Continuous Deployment Pipelines
Automating flowchart generation within your CI/CD pipeline ensures diagrams are always up-to-date, reflecting the current state of your code. This integration eliminates manual updates and keeps documentation synchronized with development.
For example, trigger flowchart generation during builds or as part of your automated testing process. This automatic update process ensures the flowcharts remain a valuable and accurate resource.
Version Control For Visual Assets
Just like your code, your flowcharts are valuable assets that require version control. Store your flowchart definitions (e.g., Mermaid code) alongside your source code in your version control system. This allows you to track changes, revert to previous versions, and collaborate on flowchart improvements.
This practice ensures consistency and maintainability and also simplifies sharing diagrams across your team.
Measuring the Impact of Visual Documentation
Track key metrics to demonstrate the value of flowchart generation. For example, measure the reduction in debugging time or the improvement in new developer onboarding speed. Quantifying these benefits justifies the investment in flowchart generation and strengthens its place in your workflow.
These metrics demonstrate tangible improvements in team efficiency and code quality.
Building Sustainable Practices
As your organization grows, your flowcharting practices need to scale. Establish clear guidelines for flowchart creation and maintenance. Provide ongoing support and training to ensure consistent usage.
This fosters a culture that values visual documentation and recognizes its contribution to long-term project success. This consistent approach helps teams quickly understand and navigate even the most complex codebases.
Ready to streamline your code documentation and enhance collaboration? TreeSnap helps you organize and prepare your codebase for effortless flowchart generation. Visit TreeSnap today to learn more and transform your workflow.