Unlocking Top-Tier Code: Essential Metrics
This listicle presents eight key code quality metrics every software developer, AI/ML practitioner, DevOps engineer, data scientist, and technical project manager should track in 2025. Understanding these metrics is crucial for building maintainable, scalable, and robust software. From Cyclomatic Complexity to DORA metrics and coupling/cohesion, you'll learn how these code quality metrics provide insights to improve your development process and create higher-quality code. Whether your project is large or small, these metrics offer valuable perspectives for enhancing your codebase.
1. Cyclomatic Complexity
Cyclomatic Complexity is a crucial code quality metric that helps developers gauge the complexity of their code. Introduced by Thomas J. McCabe in 1976, it essentially measures the number of linearly independent paths through a program's source code. This metric is valuable for identifying areas of code that might be prone to errors, difficult to test, or challenging to maintain. It quantifies complexity by calculating the number of decision points (such as if statements, for loops, while loops, case statements, etc.) within a piece of code and adding one. A higher Cyclomatic Complexity number suggests more complex code, implying potential difficulties in understanding, testing, and maintaining it.
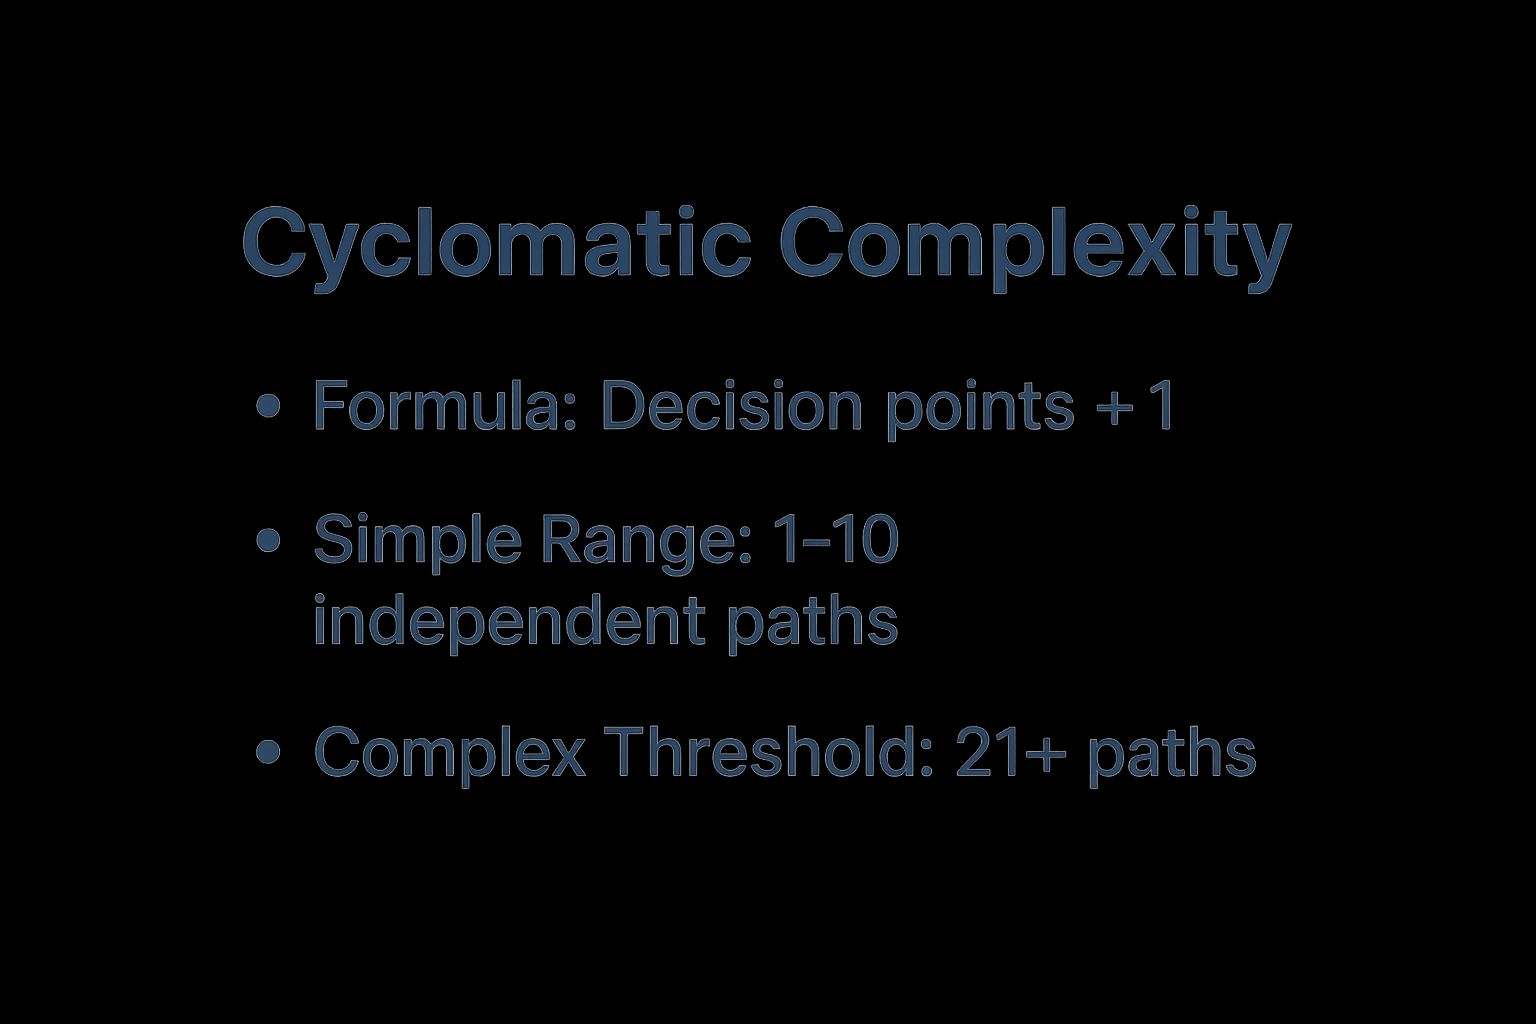
The infographic above summarizes the key takeaways regarding Cyclomatic Complexity. It visually reinforces the connection between the metric's value and the code's maintainability. As the complexity increases, so does the difficulty in understanding, testing, and maintaining the code.
This metric offers several key features. It specifically focuses on the complexity stemming from the control flow within the code, rather than other factors like data structures. The formal calculation is represented as E - N + 2P (where E represents edges, N represents nodes, and P represents connected components in the control flow graph). However, a simplified and commonly used calculation is the number of decision points plus one. Thresholds are often applied to categorize complexity, generally ranging from 1-10 for simple code to 50+ for code considered untestable. This metric can be applied at various levels of granularity, from individual methods and functions to entire classes or modules.
Pros and Cons of Using Cyclomatic Complexity:
Pros:
- Strong indicator of code maintainability: Provides a quantifiable measure that directly relates to how easily code can be maintained.
- Helps identify methods/functions that need refactoring: Pinpoints areas of code that are excessively complex and would benefit from simplification.
- Correlates with defect rates in code: Higher complexity often leads to a higher likelihood of bugs.
- Language-agnostic metric: Can be applied to code written in various programming languages.
- Easy to understand conceptually: The core concept and calculation are straightforward.
Cons:
- Doesn't account for code readability or logical complexity: While it measures control flow, it doesn't assess factors like naming conventions or the complexity of the underlying logic.
- May not reflect complexity from other sources (e.g., data structures): Focuses solely on control flow and ignores other potential sources of complexity.
- Different thresholds may apply to different programming paradigms: Optimal thresholds can vary depending on the specific programming style and language used.
- Can be manipulated without improving actual code quality: Developers might artificially lower the score without addressing the underlying complexity.
Examples of Implementation:
Many popular tools incorporate Cyclomatic Complexity. SonarQube uses it as a key indicator with defined thresholds for flagging code complexity. JetBrains' IntelliJ IDEA warns developers when methods exceed specified complexity thresholds. Microsoft's Visual Studio includes complexity analysis within its code metrics suite.
Tips for Utilizing Cyclomatic Complexity:
- Aim for methods with complexity < 10: Keeping the complexity below 10 generally ensures maintainable code.
- Break down complex methods into smaller, more focused functions: This is a key refactoring technique to reduce complexity and improve readability.
- Use automated tools to regularly check complexity across the codebase: Tools like SonarQube can automate the process of monitoring code complexity.
- Consider complexity trends over time rather than absolute values: Observing how the complexity evolves can be more informative than focusing solely on current values.
- Adapt thresholds based on your team's experience and domain: Tailor the thresholds to align with the specific context of your project and team.
Cyclomatic Complexity deserves its place in the list of code quality metrics because it provides a tangible and valuable way to assess and manage code complexity. By understanding and utilizing this metric, developers can write cleaner, more maintainable, and ultimately more robust software. This is particularly crucial for software developers, AI/ML practitioners, DevOps engineers, data scientists, and technical project managers who work with complex codebases and need to ensure the long-term quality and maintainability of their projects. By striving for lower Cyclomatic Complexity, teams can significantly reduce the risk of bugs, improve the readability of their code, and make future maintenance easier.
2. Code Coverage
Code coverage is a crucial code quality metric that measures the percentage of your codebase executed during automated testing. It provides valuable insights into the thoroughness of your test suite by identifying which parts of your code are actually being exercised by your tests. This metric tracks execution at various levels of granularity, including lines, statements, branches, functions, and conditions. By understanding how much of your code is covered by tests, you can gain a clearer picture of potential risks and areas requiring more attention. While achieving 100% code coverage doesn't guarantee the absence of bugs, it serves as a strong indicator of well-tested software and contributes significantly to overall code quality. This makes it an indispensable metric for software developers, AI/ML practitioners, DevOps engineers, data scientists, and technical project managers alike.

Code coverage is typically expressed as a percentage. For instance, 80% code coverage signifies that 80% of your codebase was executed during the test runs. Various tools provide visual reports highlighting covered and uncovered portions, often with color-coded displays (e.g., green for covered, red for uncovered), making it easy to pinpoint areas needing improvement. This information is invaluable for identifying gaps in testing and directing efforts towards writing more comprehensive tests. Furthermore, code coverage integrates seamlessly with Continuous Integration/Continuous Deployment (CI/CD) pipelines, enabling automated monitoring and enforcement of coverage thresholds. This helps maintain consistent code quality standards throughout the development lifecycle.
Features and Benefits:
- Multiple Coverage Types: Analyze coverage from different perspectives: line, statement, branch, function, and condition coverage provide varying levels of detail.
- Granular Measurement: Measure coverage at different levels – method, class, package, or module – for focused analysis.
- Visual Reports: Easily visualize covered and uncovered code sections to identify testing gaps.
- CI/CD Integration: Automate coverage monitoring and enforcement within development workflows.
- Dead Code Detection: Identify and remove unused code for a cleaner and more efficient codebase.
Pros:
- Objective Measurement: Provides a quantitative assessment of test thoroughness.
- Identifies Gaps: Highlights untested or undertested areas in the code.
- Encourages Comprehensive Testing: Motivates developers to write more robust and thorough tests.
- Workflow Integration: Fits seamlessly into existing development processes.
Cons:
- Not a Guarantee of Quality: High coverage doesn't automatically equate to high-quality tests.
- Coverage-Driven Development: Can lead to a focus on meeting coverage targets rather than writing effective tests.
- Impractical Scenarios: Some code paths (e.g., error handling) may be challenging to test comprehensively.
Examples of Successful Implementation:
- Google reportedly maintains over 80% code coverage for critical systems.
- The Django web framework achieves high coverage across its core libraries.
- Istanbul (nyc) is widely used in JavaScript projects for setting and enforcing coverage thresholds.
Actionable Tips:
- Prioritize Branch Coverage: Branch coverage provides a more comprehensive view of code execution paths than line coverage.
- Set Realistic Goals: Define achievable coverage targets based on project type and risk assessment.
- Focus on Critical Code: Concentrate testing efforts on high-risk and complex code segments.
- Use Coverage as a Guide: Treat code coverage as an informative metric, not the ultimate goal of testing.
Code coverage, when used effectively, is an invaluable tool for improving code quality. By understanding its strengths and limitations, developers can leverage this metric to build more robust, reliable, and well-tested software.
3. Technical Debt Ratio
Technical Debt Ratio is a crucial code quality metric that quantifies the proportion of technical debt relative to the size of a codebase. It provides a measurable representation of the effort required to fix all existing quality issues compared to the effort initially invested in developing the application. This metric helps teams understand the extent of remediation work needed and track the evolution of technical debt over time, enabling data-driven decisions about refactoring and maintenance. It contributes significantly to maintaining and improving code quality, making it a valuable asset in any software development project.

Technical Debt Ratio is typically expressed as a percentage or a ratio. The calculation often involves estimating the time required to fix identified code quality issues (remediation time) and dividing it by the estimated time it took to develop the affected portion of the codebase (development time). For instance, a ratio of 0.1 (or 10%) suggests that it would take 10% of the original development time to address all existing technical debt. This metric can be calculated at different granularities, from individual files and packages to the entire system, offering flexibility in assessing and managing technical debt. The calculation often integrates multiple code quality metrics, such as code complexity, code duplication, and adherence to coding standards. Some implementations also incorporate weighted penalties for different types of issues, reflecting the potential severity of their impact.
Features and Benefits:
- Expressed as a percentage or ratio: Provides a readily understandable representation of technical debt.
- Multi-level calculation: Can be calculated at file, package, or system level.
- Time-based approach: Relates remediation effort to development effort.
- Integration of multiple metrics: Provides a comprehensive view of code quality.
- Weighted penalties: Allows prioritizing critical issues.
- Makes technical debt tangible: Quantifies an otherwise abstract concept.
- Facilitates communication: Helps explain technical debt to non-technical stakeholders.
- Tracks progress over time: Enables monitoring the effectiveness of remediation efforts.
- Data-driven decision making: Supports prioritization of refactoring tasks.
- Links code quality to business impact: Highlights the potential consequences of technical debt.
Examples of Successful Implementation:
- SonarQube: Calculates Technical Debt Ratio based on detected code smells and their estimated remediation cost.
- Spotify: Utilized technical debt tracking to prioritize maintenance work within their microservices architecture.
- Microsoft: Tracks technical debt ratios across Azure services to ensure long-term quality and maintainability.
Pros:
- Makes technical debt tangible and measurable.
- Improves communication about quality issues with non-technical stakeholders.
- Provides trend data to track improvement or deterioration.
- Enables data-driven decisions about refactoring priorities.
- Can potentially link code quality to business impact.
Cons:
- Calculation methodologies vary between tools, making comparisons difficult.
- Can oversimplify complex quality issues.
- Estimates of remediation effort can be inaccurate.
- May not capture all forms of technical debt (e.g., architectural debt).
- Can be manipulated through configuration changes.
Tips for Effective Use:
- Establish baseline measurements before starting improvement efforts.
- Set realistic reduction targets (e.g., reduce debt ratio by 5% per quarter).
- Focus on preventing new debt while gradually reducing existing debt.
- Use the metric to justify the allocation of time for refactoring and code cleanup.
- Combine Technical Debt Ratio with other code quality metrics for a more holistic understanding of code health.
When and Why to Use Technical Debt Ratio:
Technical Debt Ratio is particularly useful when:
- Communicating the impact of technical debt to stakeholders: It provides a clear and concise way to explain the cost of neglecting code quality.
- Prioritizing refactoring efforts: The ratio helps identify areas of the codebase that require the most attention.
- Tracking progress over time: Monitoring the Technical Debt Ratio allows teams to assess the effectiveness of their quality improvement initiatives.
- Making data-driven decisions about resource allocation: The metric can justify investment in refactoring and code maintenance.
This metric, popularized by Ward Cunningham (who coined the term "technical debt") and adopted by tools like SonarQube and CAST Software, deserves its place in the list of essential code quality metrics because it offers a practical way to manage and mitigate the risks associated with technical debt. By providing a quantifiable measure and facilitating communication, the Technical Debt Ratio empowers teams to make informed decisions about code quality and maintain a healthy, sustainable codebase.
4. Code Duplication (Clone Detection)
Code duplication, often referred to as clone detection, is a crucial code quality metric that identifies and measures repeated code blocks within a software system. This metric plays a vital role in maintaining clean, efficient, and maintainable code, earning its spot on any list of essential code quality metrics. By analyzing and addressing code duplication, development teams can significantly improve the overall health and longevity of their projects. Learn more about Code Duplication (Clone Detection)
Duplication primarily arises from copy-paste programming, a practice often employed under pressure but ultimately detrimental to code quality. When bugs surface in duplicated code, they must be fixed in multiple locations, increasing the workload and the risk of introducing inconsistencies. Furthermore, repeated code segments bloat the codebase, making it harder to navigate, understand, and modify.
Code duplication analysis tools typically measure duplication as a percentage of duplicated lines or blocks of code. These tools go beyond simple string matching and identify different types of clones:
- Type 1 (Exact Duplicates): Identical code blocks, often a direct result of copy-pasting.
- Type 2 (Renamed Variables): Code blocks that are identical except for variable or function names.
- Type 3 (Modified Copies): Code blocks that are similar but have been modified, often with added or deleted lines.
- Type 4 (Semantic Clones): Code blocks that implement the same functionality but have different structures and syntax. These are the hardest to detect.
These tools also incorporate features like setting a minimum size threshold (e.g., 10+ lines) for considering duplicates and the ability to detect duplication across different files and modules. Visualization features, such as linking between duplicate sections, help developers quickly identify and analyze the duplicated code.
Pros of Tracking Code Duplication:
- Identifies Concrete Refactoring Opportunities: Provides a clear starting point for improving code structure and maintainability.
- Reduces Maintenance Costs: Eliminating redundancy simplifies debugging and updating code.
- Improves Code Organization: Promotes the use of abstraction and modular design principles.
- Reduces Risk of Inconsistent Bug Fixes: Ensures that bug fixes are applied consistently across all instances of a code block.
- Relatively Easy to Understand and Act Upon: The metric itself and the necessary corrective actions are straightforward.
Cons of Focusing on Code Duplication:
- Some Duplication May Be Intentional or Beneficial: Not all duplication is inherently bad. Small, isolated duplicates might not warrant refactoring.
- Simpler Tools Miss Semantic Duplication: Identifying more complex duplication patterns requires sophisticated tools.
- Extremely Low Duplication Targets May Lead to Over-Abstraction: Overzealous refactoring can introduce unnecessary complexity.
- False Positives in Generated Code or Standard Patterns: Code generators and common coding patterns can trigger false positives.
- May Not Distinguish Between Meaningful and Trivial Duplication: Focusing on trivial duplicates can distract from more significant code quality issues.
Examples of Successful Implementation:
- Google maintains a strict policy of keeping code duplication below 5% in its core libraries.
- The Linux kernel developers employ targeted refactoring strategies to reduce duplication within driver code, improving maintainability and reducing the risk of inconsistencies.
- Apache Commons libraries maintain less than 2% duplication through careful abstraction and adherence to best practices.
Actionable Tips for Reducing Code Duplication:
- Target 5-10% Maximum Duplication: A reasonable target for most projects.
- Prioritize Duplicates Spanning Multiple Files/Packages: These often represent greater opportunities for improvement.
- Consider the "Rule of Three": Refactor after code is duplicated three times.
- Utilize "Extract Method" and "Extract Class" Refactorings: Effective techniques for eliminating duplication.
- Configure Duplication Detection Tools: Exclude test data, generated code, or simple getters/setters from analysis.
Popular Tools for Code Duplication Detection:
- PMD CPD (Copy-Paste Detector)
- SonarQube
- DuplicateCodeDetector
- JetBrains tools (e.g., IntelliJ IDEA)
- Simian
By actively monitoring and addressing code duplication, software developers, AI/ML practitioners, DevOps engineers, data scientists, and technical project managers can create more robust, maintainable, and efficient software systems. This metric, while not the only indicator of code quality, offers valuable insights into potential areas for improvement and helps teams build better software.
5. Static Analysis Violations
Static Analysis Violations, as a crucial code quality metric, provide a powerful way to proactively identify and address code issues before they manifest as bugs in production. This method leverages static analysis tools, which examine the source code without actually executing the program. By scrutinizing the codebase against predefined rules and patterns, these tools can uncover potential bugs, security vulnerabilities, code smells (indicators of deeper problems), and deviations from coding standards. Tracking and managing these violations is essential for any team aiming to improve code quality and reduce technical debt.
Static analysis works by parsing the source code and applying a set of rules. These rules can be built-in, addressing common programming errors like null pointer dereferences or buffer overflows, or custom-defined to enforce organization-specific coding standards. The tools then flag any violations, providing developers with detailed reports including the location, severity, and type of each issue. This allows for targeted remediation and prevents problems from propagating further down the development lifecycle.
Features and Benefits:
Static analysis tools offer a range of features that make them valuable for code quality management:
- Categorization by Severity: Violations are typically categorized by severity levels (e.g., critical, major, minor, info), enabling teams to prioritize the most impactful issues.
- Classification by Type: Categorizing violations by type (e.g., security, reliability, maintainability, performance) facilitates focused efforts on specific code quality aspects.
- Rule-based Detection: The core strength of static analysis lies in its ability to automatically detect common programming errors based on predefined rules.
- Custom Rule Support: Organizations can create custom rules to enforce their specific coding standards and address domain-specific concerns.
- Trend Analysis: Tracking the introduction and resolution rates of violations provides insights into the overall code quality trend and the effectiveness of remediation efforts.
Pros and Cons:
Like any code quality metric, static analysis has its advantages and disadvantages:
Pros:
- Early Issue Detection: Identifies potential problems early in the development lifecycle, reducing the cost and effort of fixing them later.
- Consistent Coding Standards: Enforces coding style and best practices across the codebase, leading to improved readability and maintainability.
- Bug Prevention: Catches bugs that might escape traditional testing methods, improving software reliability.
- Developer Education: Provides valuable feedback to developers, helping them learn about best practices and avoid common pitfalls.
- Scalability: Scales efficiently to large codebases, making it suitable for complex projects.
Cons:
- False Positives: Static analysis tools can sometimes flag issues that are not actual problems, requiring manual review and potentially wasting time.
- Initial Overwhelm: Introducing static analysis to a legacy codebase can initially generate a large number of violations, which can be daunting to address.
- Contextual Limitations: Some rules may not apply to all contexts, requiring careful configuration and customization.
- Limited Scope: Static analysis is less effective at detecting complex logical errors or issues related to runtime behavior.
- Project-Specific Tuning: Requires tuning and customization to effectively address the specific needs and characteristics of each project.
Examples of Successful Implementation:
Many leading organizations leverage static analysis to maintain high code quality standards:
- Google enforces a zero-tolerance policy for critical static analysis issues in its massive codebase.
- Amazon Web Services uses custom static analysis rules to prevent cloud-specific vulnerabilities.
- NASA's Jet Propulsion Laboratory relies on static analysis to meet the ultra-high reliability requirements of its space missions.
Actionable Tips:
To effectively utilize static analysis violations as a code quality metric:
- Prioritize High-Severity Issues: Start by addressing critical and major violations before tackling lower priority ones.
- Integrate with CI/CD: Configure CI/CD pipelines to fail on new critical or major violations, preventing the introduction of new issues.
- Customize Rule Sets: Tailor the rule sets to align with the team's specific quality goals and project requirements.
- Incremental Analysis: Run incremental analysis on changed files for faster feedback during development.
- "Clean as You Go": Encourage developers to address violations as they are introduced, rather than relying on periodic cleanups.
Learn more about Static Analysis Violations
By incorporating Static Analysis Violations as a key code quality metric and following these best practices, development teams can build more robust, reliable, and maintainable software. This proactive approach helps prevent bugs early in the development cycle, ultimately saving time, resources, and contributing to a higher quality end product. This is why tracking and managing Static Analysis Violations deserves a prominent place in any comprehensive code quality strategy.
6. Maintainability Index
The Maintainability Index (MI) is a crucial code quality metric that provides a holistic view of how easy it is to maintain and modify a software system. It deserves a place on this list because it aggregates several factors impacting maintainability into a single, easily digestible score, facilitating quick assessments and high-level tracking of code quality. This is particularly valuable for software developers, AI/ML practitioners, DevOps engineers, data scientists, and technical project managers who need to monitor and manage the long-term health of their codebases.
Instead of focusing on isolated aspects like code style or complexity, the MI combines multiple base metrics into a composite score, typically ranging from 0 to 100, where higher scores indicate better maintainability. Key components factored into the MI calculation often include:
- Cyclomatic Complexity: Measures the number of independent paths through a piece of code, reflecting its complexity and testability.
- Lines of Code (LOC): While not a perfect measure, LOC provides a general indication of code size, which can correlate with maintainability challenges.
- Halstead Volume: A measure of program size and complexity based on the number of distinct operators and operands used.
Different variants of the MI formula exist, including the original SEI formula and a modified version used by Microsoft in Visual Studio. These formulas differ slightly in their weighting of the contributing metrics. The MI score is often color-coded (green/yellow/red) for rapid visual assessment. This allows developers and project managers to quickly identify potential problem areas that warrant further investigation.
Benefits of Using the Maintainability Index:
- Single, Consolidated Score: Provides a quick overview of maintainability.
- Multi-faceted Perspective: Considers multiple code quality aspects, offering a more balanced view than isolated metrics.
- Trend Analysis: Tracking MI over time reveals whether maintainability is improving or deteriorating.
- Large Codebase Management: Helps pinpoint areas requiring attention within extensive projects.
Limitations of the Maintainability Index:
- Abstraction: While offering a high-level summary, MI hides the underlying causes of low maintainability. You'll need to drill down into the component metrics (cyclomatic complexity, etc.) to understand the specific issues.
- Formula Variations: Different tools may employ slightly different MI formulas, leading to varying results.
- Incomplete Picture: MI may not capture all aspects affecting maintainability, such as code duplication or adherence to coding standards.
- Sensitivity to Codebase Structure: The MI can be influenced by the size and organization of the codebase, making comparisons across disparate projects less meaningful.
Examples of Successful Implementation:
- Microsoft Visual Studio: Integrates MI calculations directly into its code analysis tools.
- Philips Healthcare: Utilizes MI to monitor the maintainability of its medical device software, ensuring long-term supportability.
- US Department of Defense: Employs MI thresholds for evaluating the quality of contractor-delivered code.
Actionable Tips for Utilizing the Maintainability Index Effectively:
- Target Scores Above 65-70: These are generally considered acceptable, though optimal ranges can vary depending on project context.
- Drill Down for Details: Use MI as an initial indicator, followed by deeper analysis of specific metrics to pinpoint and address underlying problems.
- Track Trends: Focus on changes in MI over time rather than absolute values. This reveals the impact of code changes on maintainability.
- Compare Similar Components: Compare MI scores for similar modules or classes within a project rather than across different types of code.
- Complement with Other Metrics: Combine MI with other targeted metrics like code duplication analysis or static analysis tools for a more comprehensive quality assessment.
By using the Maintainability Index strategically and understanding its limitations, development teams can gain valuable insights into the maintainability of their code, leading to improved software quality and reduced long-term development costs.
7. DORA Metrics (Change Failure Rate)
Change Failure Rate, a crucial code quality metric within the DORA (DevOps Research and Assessment) framework, measures the percentage of deployments that result in failures in production. It provides a direct link between development practices and operational outcomes, offering valuable insights into the stability and reliability of delivered software. This metric is essential for any team striving to improve code quality and deliver value faster, making it a worthy inclusion in this list of essential code quality metrics.
This metric works by tracking deployments and identifying those that lead to production incidents. A "failure" can be defined in various ways, from system outages and critical bugs to performance degradations and user-facing errors. The Change Failure Rate is then calculated by dividing the number of failed deployments by the total number of deployments within a given period (e.g., weekly, monthly, quarterly). Tracking this metric over time allows organizations to identify trends and evaluate the impact of quality improvement initiatives.
Features and Benefits:
- Focus on Outcomes: Unlike metrics that analyze internal code characteristics, Change Failure Rate focuses on the ultimate outcome – the success or failure of a deployment. This provides a business-centric view of code quality.
- Key DORA Metric: It is one of the four key metrics defined by DORA for assessing software delivery performance (along with Deployment Frequency, Lead Time for Changes, and Mean Time to Recovery).
- Actionable Insights: A high Change Failure Rate signals the need for improvements in testing, quality assurance, and deployment processes.
- Easy to Understand: Its simplicity makes it easily comprehensible for both technical and non-technical stakeholders.
Pros:
- Directly correlates with the business impact of quality issues.
- Provides an objective measure of delivered code quality.
- Encourages proper testing and quality assurance practices.
- Easy for both technical and non-technical stakeholders to understand.
- Directly links development practices to operational results.
Cons:
- Requires robust production monitoring and incident tracking for accurate measurement.
- May discourage innovation if teams become overly risk-averse.
- Doesn't differentiate between major and minor failures without additional classification.
- Can be influenced by factors outside the development team's control (e.g., infrastructure issues).
- May take time to observe improvements after implementing quality initiatives.
Examples of Successful Implementation:
- Elite Performers: DORA's research shows that elite-performing organizations maintain a Change Failure Rate of 0-15%. This demonstrates the feasibility of achieving very low failure rates with the right practices in place.
- Netflix: Netflix leverages canary deployments, gradually rolling out changes to a small subset of users before full deployment. This allows them to identify and address failures early, minimizing the impact on the broader user base.
- Google: Google tracks Change Failure Rate across various services and teams. This helps identify teams struggling with quality and provides targeted support where it’s needed most.
Actionable Tips:
- Define "Failure": Establish a clear definition of what constitutes a "failure" within your organization’s context.
- Implement Monitoring: Invest in comprehensive post-deployment monitoring to detect issues quickly.
- Use Feature Flags: Utilize feature flags to control the rollout of new features and contain the impact of potential failures.
- Conduct Blameless Post-Mortems: Foster a culture of learning from failures through blameless post-mortems. Analyze the root causes of failures and identify areas for improvement.
- Balance with Deployment Frequency: Strive for a balance between Change Failure Rate and Deployment Frequency. Ensuring high quality shouldn't come at the expense of slowing down delivery.
Popularized By:
- Nicole Forsgren, Jez Humble, and Gene Kim (authors of Accelerate)
- Google Cloud’s DevOps Research and Assessment (DORA) team
- State of DevOps Reports
When and why should you use this approach? Change Failure Rate is a vital metric for any organization seeking to improve the quality and reliability of its software delivery. It is especially relevant for teams adopting DevOps practices and aiming to accelerate their release cycles while maintaining stability. By tracking and actively managing this metric, teams can identify weaknesses in their processes, make data-driven improvements, and ultimately deliver better software to their users. While there are potential downsides, the benefits of understanding and reducing your Change Failure Rate significantly outweigh the challenges.
8. Coupling and Cohesion Metrics
Coupling and cohesion metrics are essential code quality metrics that provide insights into the structural integrity and maintainability of a software system. They evaluate how different components of the system interact with each other and how well-organized the elements within each component are. These metrics play a crucial role in assessing the system's modularity, adherence to object-oriented principles, and overall quality, making them valuable for software developers, AI/ML practitioners, DevOps engineers, data scientists, and technical project managers alike.
Coupling measures the degree of interdependence between different modules or components. Lower coupling is desirable as it indicates greater independence and isolation between modules. This leads to easier modification, testing, and reuse of individual components without affecting other parts of the system. Conversely, high coupling suggests a tightly interconnected system where changes in one module can have cascading effects on others, increasing the risk of introducing bugs and making maintenance challenging.
Cohesion, on the other hand, measures how strongly related the functions within a single module are. High cohesion signifies that the elements within a module work together towards a single, well-defined purpose. This improves code readability, understandability, and maintainability. Low cohesion, in contrast, suggests a module containing unrelated functionalities, leading to confusion and difficulty in modifying or extending the module.
Several metrics help quantify coupling and cohesion. Common coupling metrics include Afferent Coupling (Ca), which counts the number of incoming dependencies to a module; Efferent Coupling (Ce), counting outgoing dependencies; and Instability (I), which relates Ca and Ce. Common cohesion metrics include Lack of Cohesion of Methods (LCOM), which measures the dissimilarity of methods within a class, and Class Cohesion. These metrics can be analyzed at various levels, from individual methods and classes to packages and entire modules. Visualization tools like dependency graphs and heat maps often enhance the understanding of these metrics by visually representing the relationships between components. They are also frequently combined to form composite metrics like Relational Cohesion, providing a more holistic view of code structure.
Examples of Successful Implementation:
- Spring Framework: Achieves low coupling by leveraging dependency injection and interfaces, promoting modularity and testability.
- Linux Kernel: Maintains manageable coupling through well-defined module interfaces, allowing for independent development and evolution of kernel components.
- React.js Components: Demonstrate high cohesion by encapsulating related UI functionality within individual components, improving code organization and reusability.
Tips for Improving Coupling and Cohesion:
- Prioritize Decoupling: Focus on reducing coupling between unrelated components first.
- Leverage Dependency Inversion: Use dependency inversion principles to minimize dependencies between modules.
- Refactor for Cohesion: Refactor classes with low cohesion into multiple, more focused classes.
- Monitor Metrics During Architectural Changes: Track coupling and cohesion metrics when making architectural changes to ensure improvements in code structure.
- Optimize Package Structure: Carefully consider package structure and organization to promote both low coupling and high cohesion. Learn more about Coupling and Cohesion Metrics for helpful insights into structuring your projects effectively.
Pros of Using Coupling and Cohesion Metrics:
- Identify Design Flaws: Helps pinpoint architectural and design issues in the code structure.
- Predict Maintainability: Provides insights into the maintainability and adaptability of the system.
- Enforce Best Practices: Supports the enforcement of separation of concerns and modularity principles.
- Guide Refactoring Efforts: Identifies opportunities for refactoring and code improvement.
- Evaluate SOLID Adherence: Useful for evaluating adherence to SOLID principles, especially the Single Responsibility Principle (SRP) and Dependency Inversion Principle (DIP).
Cons of Using Coupling and Cohesion Metrics:
- Variability in Formulas: Multiple variations of formulas exist for the same metrics, leading to potential inconsistencies.
- Context-Dependent Optimal Values: Optimal values depend on the specific system context and architecture.
- Limitations of Certain Metrics: Some metrics, such as LCOM, have known limitations and variations.
- Interpretation Challenges: May be complex to interpret without visualization tools.
- Difficulty in Setting Universal Thresholds: Establishing universal thresholds across different projects can be challenging.
Coupling and cohesion metrics are powerful tools for assessing and improving code quality. By understanding and applying these metrics, development teams can build more robust, maintainable, and scalable software systems. These metrics have been popularized by influential figures like Robert C. Martin (Uncle Bob), known for his advocacy of SOLID principles, and through metric suites like Chidamber and Kemerer, tools like JDepend, Structure101, and NDepend. They deserve a prominent place in any discussion of code quality due to their ability to reveal underlying structural issues and guide developers towards better design practices.
Code Quality Metrics Comparison
| Metric | 🔄 Implementation Complexity | 🧰 Resource Requirements | 📊 Expected Outcomes | 💡 Ideal Use Cases | ⭐ Key Advantages |
|---|---|---|---|---|---|
| Cyclomatic Complexity | Moderate – requires code flow analysis | Static code analysis tools or IDE plugins | Identifies code complexity and refactoring points | Code maintainability assessment, testing prioritization | Strong indicator of maintainability; language-agnostic |
| Code Coverage | Moderate – requires test instrumentation | Testing framework and coverage analysis tools | Measures test thoroughness via % of executed code | Improving testing quality and coverage | Objective test quality measure; integrates with CI/CD |
| Technical Debt Ratio | High – requires aggregation of metrics | Analysis tools combining remediation and dev effort | Quantifies remediation effort vs development effort | Prioritizing refactoring, communicating quality to stakeholders | Converts technical debt to tangible ratio; trend tracking |
| Code Duplication (Clone Detection) | Moderate – requires duplicate detection | Static analysis tools with clone detection | Measures % of repeated code blocks, highlights redundancy | Reducing redundant code and maintenance overhead | Easy to understand; identifies concrete refactoring targets |
| Static Analysis Violations | High – requires configuring rule sets | Static code analyzers with custom rules | Tracks coding standard violations and potential bugs | Early bug detection, enforcing coding standards | Early issue detection; educates developers on best practices |
| Maintainability Index | Moderate – composite of multiple metrics | Tools combining complexity, LOC, and Halstead data | Single score indicating code maintainability | High-level maintainability overview | Balanced metric; tracks trends; easy-to-understand score |
| DORA Metrics (Change Failure Rate) | Low – based on deployment monitoring | Production incident tracking and monitoring systems | % of failed deployments indicating production stability | Measuring release quality and operational impact | Business-impact focused; easy for all stakeholders to interpret |
| Coupling and Cohesion | High – requires architectural analysis | Advanced static analysis and visualization tools | Evaluates modularity and design quality | Architectural review, modularity enforcement | Predicts maintainability; supports SOLID principles |
Level Up Your Code: Actionable Insights from Metrics
By understanding and actively monitoring the eight key code quality metrics discussed—cyclomatic complexity, code coverage, technical debt ratio, code duplication, static analysis violations, maintainability index, DORA metrics (like change failure rate), and coupling and cohesion—development teams gain invaluable insights into the health and maintainability of their software systems. These metrics provide a powerful lens through which to assess code quality, pinpoint potential problem areas, and track progress over time. Remember that code quality metrics should be used as guiding principles, not strict rules. Adapt metric thresholds and interpretations based on the specific context of your projects, prioritizing balance and practicality.
The key takeaway is that a proactive and continuous approach to managing code quality, driven by data-driven decisions, yields significant long-term benefits. Mastering these concepts empowers teams to produce robust, maintainable, and scalable code, reducing technical debt and fostering a more efficient development lifecycle. By embracing the power of code quality metrics, you can elevate your codebase, streamline development processes, and build software that stands the test of time.
Ready to take control of your code quality and unlock deeper insights into your projects? Explore how TreeSnap can simplify the tracking and analysis of these critical code quality metrics across your entire codebase. Visit TreeSnap to learn more and start your free trial today.
Article created using Outrank