Visualizing Code: A Clearer Path Through Complexity
Understanding complex codebases can be challenging. This listicle presents ten essential code visualization tools to help software developers, AI/ML practitioners, DevOps engineers, data scientists, and technical project managers navigate intricate projects. Learn how these tools simplify comprehension of dependencies, component relationships, and overall software architecture, accelerating development and boosting collaboration. We'll cover Visual Studio Code, CodeSee, Understand, Sourcetrail, Code2flow, Graphviz, Gephi, Codemap, NDepend, and CodeLogic. Dive in and discover how these code visualization tools can clarify your code's complexities.
1. Visual Studio Code
Visual Studio Code (VS Code) has rapidly become a favorite among developers, and for good reason. While not strictly a dedicated code visualization tool, its extensible architecture and vibrant community have transformed it into a powerhouse for visualizing code in various ways. Its free and open-source nature, coupled with a robust extension marketplace, allows developers to tailor their visualization experience to their specific needs, making it a versatile option for software developers, AI/ML practitioners, DevOps engineers, data scientists, and technical project managers seeking enhanced code comprehension. Whether you're navigating a complex codebase, debugging an intricate algorithm, or simply trying to understand the structure of a project, VS Code offers valuable tools to aid in code visualization. It earns its place on this list due to its adaptability and the sheer breadth of visualization options it offers through extensions, transforming a simple code editor into a powerful visualization platform.
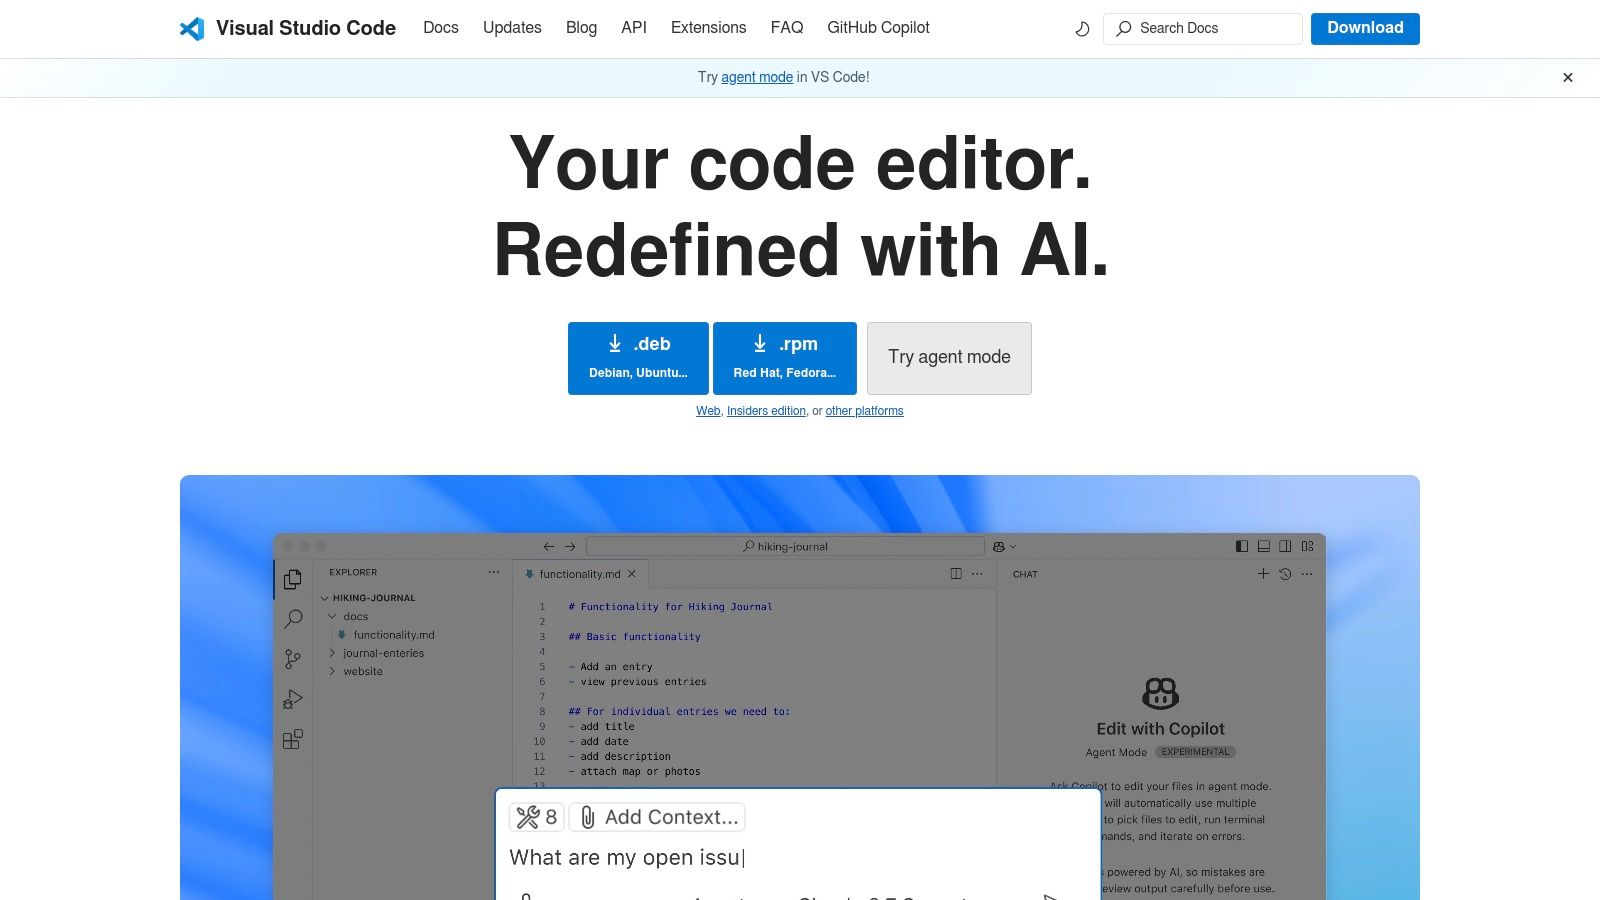
One of VS Code’s most impactful built-in code visualization features is the minimap. This feature provides a condensed, bird’s-eye view of the entire code file, allowing developers to quickly navigate to different sections without scrolling endlessly. Especially beneficial for large files, the minimap offers a visual representation of the code's structure, highlighting function definitions, code blocks, and other key elements.
Syntax highlighting, another integral visualization feature, uses color-coding to differentiate various code elements like keywords, variables, and comments. VS Code supports a wide array of themes that cater to individual preferences and coding styles, enhancing readability and making it easier to identify patterns and potential errors within the code. This visual distinction of code components drastically improves comprehension, especially when working with complex or unfamiliar codebases. Combined with code folding and outlining, developers can collapse and expand sections of code based on their structure, simplifying navigation and allowing for a more focused view.
The true strength of VS Code for code visualization, however, lies in its extensive extension marketplace. Here, developers can find a vast collection of plugins dedicated to enhancing code visualization capabilities. These extensions offer a variety of specialized visualizations, from call graphs and control flow diagrams to dependency trees and even interactive 3D code representations. For example, extensions like "Bracket Pair Colorizer" enhance code readability by visually matching corresponding brackets, while others like "Indent-Rainbow" use color to visually represent indentation levels, making it easier to track nested code blocks. This ability to customize the visualization environment through extensions allows users to tailor VS Code to their specific needs and project requirements.
VS Code’s integrated debugger also provides powerful visual debugging capabilities. Developers can set breakpoints, step through code execution, and inspect variables in real-time, all within a visual interface. This allows for a more intuitive and efficient debugging process, simplifying the identification and resolution of code errors.
VS Code is free and open-source, available on Windows, macOS, and Linux. There are no specific technical requirements beyond a reasonably modern operating system and sufficient disk space. While VS Code itself is lightweight, installing numerous extensions can increase resource consumption. It's also worth noting that while VS Code offers basic visualization features out-of-the-box, leveraging its full potential requires exploring and configuring relevant extensions. This can involve some initial setup and learning, but the resulting enhanced visualization capabilities are generally considered worth the effort.
Compared to dedicated code visualization tools, VS Code offers a more integrated development environment, combining visualization capabilities with code editing, debugging, and version control features. While some specialized tools may offer more advanced visualizations for specific use cases, VS Code’s extensibility makes it a more versatile choice for a wider range of development tasks.
To get started with code visualization in VS Code, download and install the application from https://code.visualstudio.com/. Once installed, explore the extension marketplace by searching for keywords like "visualization," "diagram," "graph," or the specific type of visualization you require. Install the desired extensions, configure them as needed, and start visualizing your code to gain a deeper understanding of its structure, behavior, and dependencies.
2. CodeSee
CodeSee is a powerful code visualization platform designed to help developers navigate, understand, and collaborate on complex codebases. Unlike static code diagrams, CodeSee automatically generates interactive maps that dynamically reflect the relationships between files, functions, and dependencies within a project. This dynamic approach offers significant advantages for software development teams, particularly when dealing with large or rapidly evolving codebases. CodeSee aims to bridge the gap between the code itself and the mental model developers maintain, making it easier to onboard new team members, conduct thorough code reviews, and anticipate the impact of changes. This makes it a highly valuable tool for any development team seeking to improve code comprehension and streamline their workflow. It firmly deserves its place among the top code visualization tools due to its automated mapping, interactive exploration features, and integration with existing development workflows.
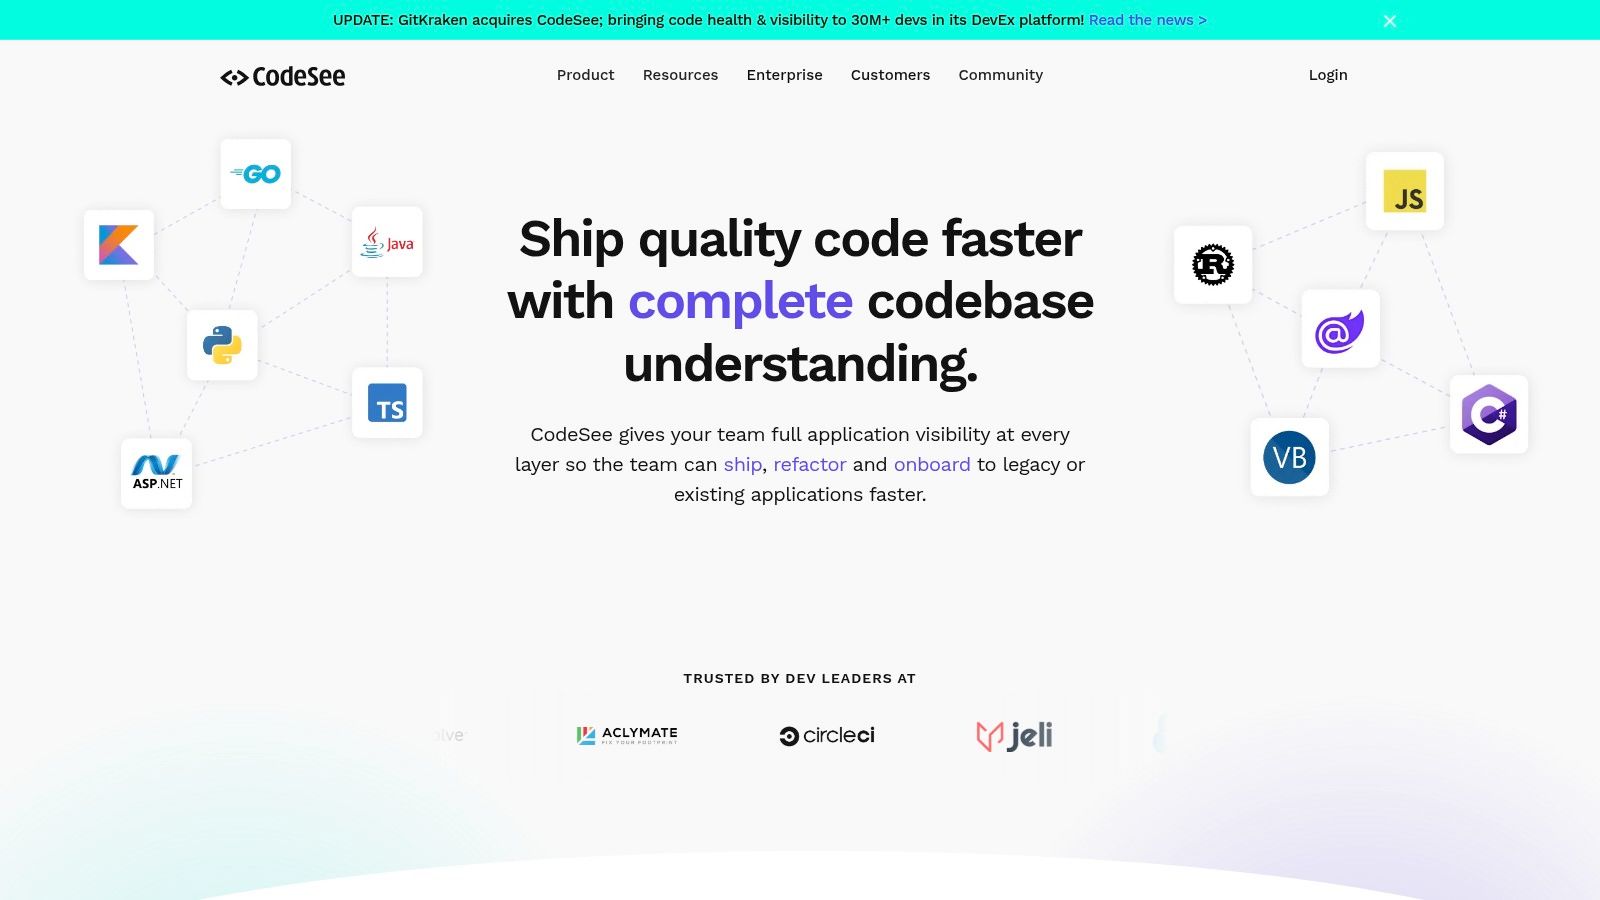
One of the core strengths of CodeSee is its automatic codebase mapping. Upon connecting CodeSee to a Git repository, the platform analyzes the code and automatically generates an interactive map. This map visually represents the project's architecture, displaying files, folders, functions, and the connections between them. This automation eliminates the tedious manual process of creating and maintaining diagrams, saving developers significant time and effort. This is particularly valuable in large projects where manually documenting the architecture would be a near-impossible task. The interactive nature of the maps allows developers to explore the codebase by clicking on elements to see related files, dependencies, and even the code itself. This facilitates a deeper understanding of how different parts of the system interact and contributes to more effective debugging and troubleshooting.
CodeSee also offers valuable features for impact analysis. Before making changes to the code, developers can use CodeSee to visualize the potential impact of those changes. This allows them to anticipate any unintended consequences and minimize the risk of introducing bugs. This proactive approach can significantly reduce debugging time and improve the overall quality of the software. The integration with Git workflows further strengthens this capability, enabling developers to see the impact of changes directly within their pull requests. CodeSee's team collaboration features further enhance the development process. The shared maps provide a common visual language for discussing code, which is particularly useful during code reviews. New team members can also use the maps to quickly onboard themselves and understand the project's architecture, reducing the time it takes for them to become productive.
While CodeSee offers a powerful set of features, it's important to consider its limitations. CodeSee is a paid service with a limited free tier. The pricing depends on the number of users and the features required, and potential users should evaluate the pricing structure to determine if it aligns with their budget. Accessing the full suite of features typically requires a subscription. The platform also requires access to the code repository, which might raise security concerns for some organizations. Finally, while the interface is generally intuitive, mastering some of the more advanced features, such as customized visualizations and advanced impact analysis, might require a learning curve.
Compared to other code visualization tools, CodeSee differentiates itself through its focus on automation and interactivity. While some tools require manual diagram creation or only provide static visualizations, CodeSee automatically generates dynamic maps that evolve with the codebase. This makes it a more practical and scalable solution for complex projects. Setting up CodeSee is generally straightforward. It involves connecting the platform to the code repository and granting the necessary permissions. The automatic mapping process then begins, and the generated maps are accessible through the CodeSee interface. For more specific setup instructions and documentation, refer to the official CodeSee website: https://www.codesee.io/
In summary, CodeSee provides a valuable service to developers seeking to improve their understanding and management of complex codebases. Its automatic mapping, interactive visualizations, and integration with Git workflows provide a potent combination of features. While the pricing model and repository access requirements should be considered, the benefits in terms of improved code comprehension, streamlined code reviews, and efficient onboarding make CodeSee a valuable addition to the toolbox of any modern software development team.
3. Understand
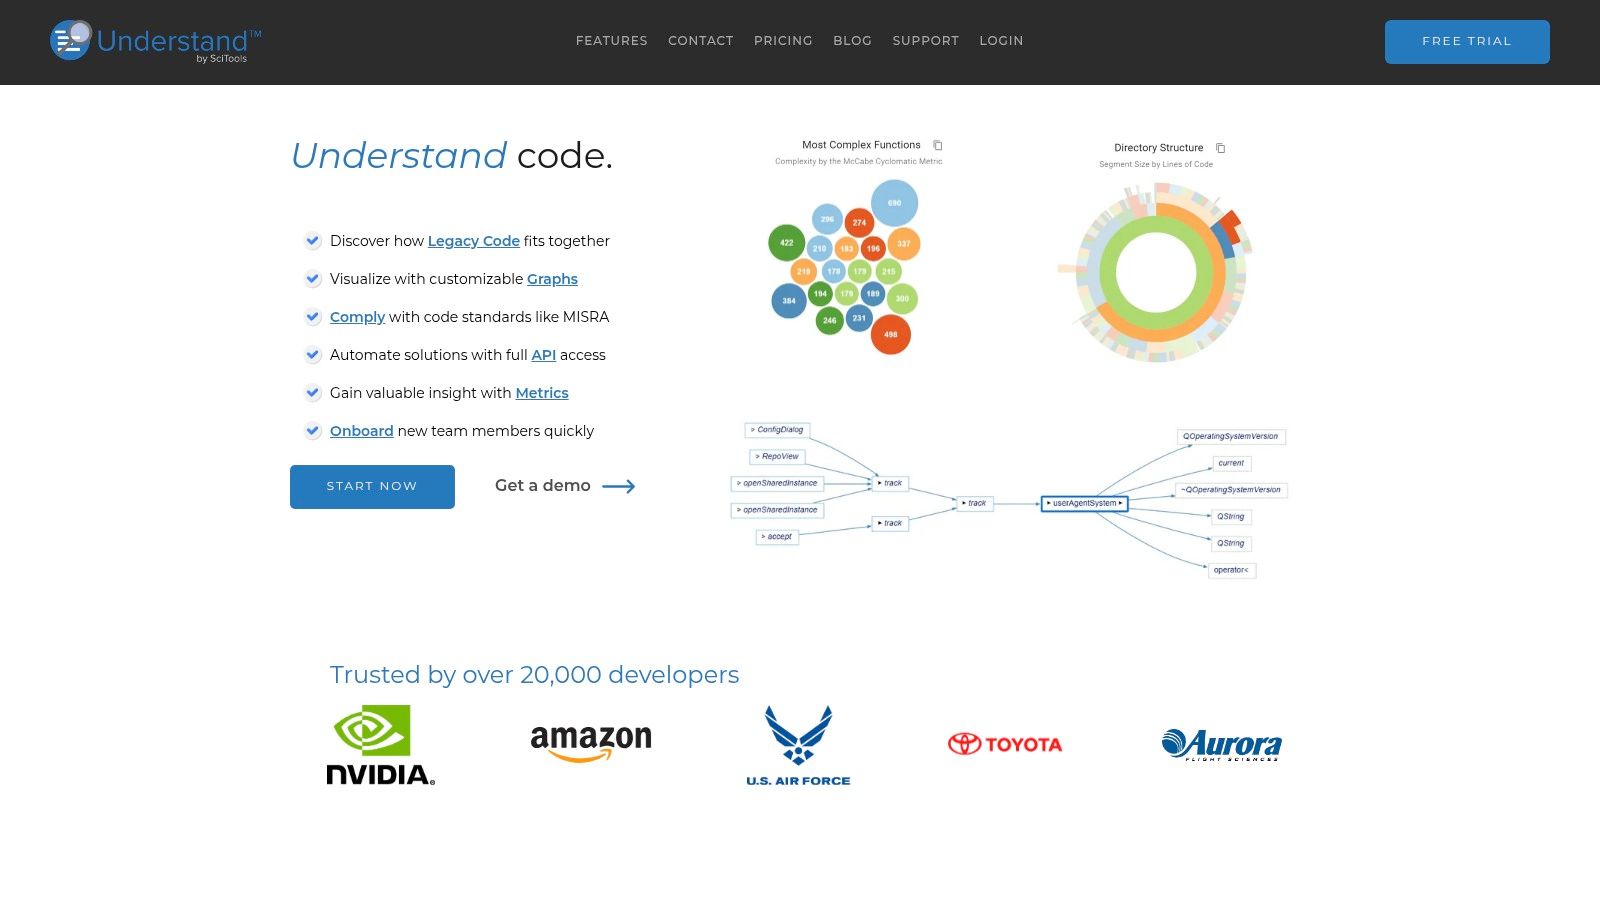
Understand by SciTools is a robust, static code analysis and visualization tool designed to dissect complex software systems. Unlike tools that focus solely on visualizing code execution, Understand provides a holistic view of a codebase's architecture, dependencies, and metrics, making it especially valuable for navigating and comprehending large, often legacy, projects. This tool goes beyond simple code visualization, offering deep analysis capabilities that help developers truly understand their software. This positions it as a professional-grade solution, catering to developers who need a powerful tool for serious code analysis and maintenance.
One of Understand's key strengths lies in its ability to handle large codebases written in a multitude of programming languages. With support for over 20 languages, including C++, Java, Python, and Ada, Understand is a versatile tool applicable to a diverse range of projects. This cross-language support makes it particularly valuable for organizations working with legacy systems or projects that incorporate multiple languages. Imagine being tasked with maintaining a decades-old system written in C++ with patches and additions in Java – Understand can provide a unified view of this heterogeneous codebase, greatly simplifying the process of understanding and refactoring.
Understand offers a wealth of features centered around static code analysis, interactive visualizations, and comprehensive reporting. Its static analysis capabilities go deep, providing metrics on code complexity, dependencies, and potential bugs. The interactive graphs and charts visualize these metrics, allowing developers to explore the codebase’s structure, identify hotspots, and trace dependencies visually. For instance, you can generate call graphs to understand the flow of control, dependency graphs to visualize module interconnections, and architecture diagrams to gain a high-level overview of the system. Furthermore, Understand facilitates code comprehension through automated documentation generation, including cross-referencing features that enable developers to quickly navigate between different parts of the codebase. These features are crucial for onboarding new team members or understanding unfamiliar code segments.
For teams looking to improve code quality and maintainability, Understand provides indispensable insights. By analyzing code metrics like cyclomatic complexity and code duplication, developers can pinpoint areas requiring refactoring and optimization. The tool also offers code auditing capabilities, helping to enforce coding standards and identify potential vulnerabilities. This contributes significantly to reducing technical debt and building more robust and maintainable software systems. Learn more about Understand and how it can contribute to better code structure practices.
While Understand is a powerful tool, it does have certain limitations. Its licensing model is expensive, making it less accessible for individual developers or smaller teams. Furthermore, the sheer depth of features can lead to a steep learning curve. The interface can be overwhelming initially, requiring some time investment to master its functionalities. Finally, its extensive analysis capabilities might be overkill for smaller, simpler projects where a lighter-weight code visualization tool might suffice.
While specific pricing details are available upon request from SciTools, Understand is generally considered a premium tool with a corresponding price tag. Technical requirements vary depending on the languages being analyzed, but generally require a moderately powerful computer with sufficient RAM to handle large codebases.
Compared to free or open-source code visualization tools, Understand offers significantly deeper analysis capabilities and more sophisticated visualization options. Tools like Doxygen or Graphviz may be suitable for generating basic documentation and graphs, but they lack the comprehensive features and advanced analysis offered by Understand. For developers working with complex codebases or engaged in serious software maintenance, Understand provides a valuable investment, despite the associated cost and learning curve.
Setting up Understand involves downloading the relevant package for your operating system and installing it. Once installed, you can import your codebase by specifying the project directory. Understand will then analyze the code and generate the various graphs, metrics, and documentation. It’s recommended to start with a smaller subset of the codebase to familiarize yourself with the interface and various functionalities before tackling the entire project.
In conclusion, Understand excels as a professional-grade code visualization and analysis tool specifically geared towards tackling the challenges of large and complex software systems. Its powerful capabilities come at a cost, both financially and in terms of the learning curve. However, for teams requiring a deep understanding of their codebase, particularly when dealing with legacy systems or multiple programming languages, Understand provides invaluable insights that can significantly improve software quality, maintainability, and development efficiency.
4. Sourcetrail
Sourcetrail is a powerful open-source, cross-platform code visualization tool designed to help developers navigate and comprehend complex codebases. It achieves this by creating interactive graphs and diagrams that visually represent the structure, dependencies, and relationships within the code. While active development on Sourcetrail has been discontinued, it remains a valuable and usable tool for those seeking a free and effective method to explore and understand existing code projects. Its ability to generate visual representations of call graphs, inheritance hierarchies, and other code relationships makes it particularly useful when tackling large or unfamiliar projects. For developers seeking a visual approach to code comprehension, Sourcetrail remains a relevant option amongst available code visualization tools.
One of Sourcetrail's core strengths lies in its interactive code exploration capabilities. Users can click through the visualized graph, seamlessly transitioning between different parts of the codebase. For example, selecting a function call within the graph will immediately highlight its definition, allowing developers to quickly understand its purpose and implementation. This interactive exploration fosters a deeper understanding of the code's architecture and flow. Furthermore, Sourcetrail provides visual call graphs, offering a clear representation of function call relationships. This is particularly useful for identifying dependencies, tracing execution paths, and understanding the overall flow of the program.
Sourcetrail supports multiple programming languages, including C, C++, Java, and Python, making it applicable to a wide range of projects. Its built-in search and navigation tools allow developers to quickly locate specific classes, functions, or variables within the visualized codebase. The code location tracking feature further enhances navigation by allowing users to bookmark important code segments and easily return to them later.
For software developers, Sourcetrail can significantly reduce the time and effort required to understand legacy code or onboard onto new projects. AI/ML practitioners working with complex algorithms can use it to visualize the interactions between different components of their models. DevOps engineers benefit from the tool's ability to quickly analyze code dependencies, facilitating efficient troubleshooting and deployment. Data scientists can use Sourcetrail to understand the underlying code of data processing pipelines, enabling them to identify bottlenecks and optimize performance. Technical project managers can leverage Sourcetrail’s visualizations to gain a high-level understanding of the code architecture and progress, facilitating better communication with the development team.
While Sourcetrail offers numerous benefits, it's important to be aware of its limitations. The most significant drawback is that development has been discontinued, meaning there will be no further updates or bug fixes. This also implies limited language support; newer languages or frameworks might not be compatible. Additionally, there's a risk of compatibility issues arising with newer versions of currently supported languages. This is particularly pertinent for projects using cutting-edge language features or libraries. While Sourcetrail offers cross-platform compatibility, working with newer operating systems or IDEs might introduce unforeseen challenges.
Setting up Sourcetrail is relatively straightforward. Download the relevant package for your operating system from the official website and follow the installation instructions. To use Sourcetrail, you need to create a project and specify the location of your source code. Sourcetrail then indexes the codebase and generates the interactive visualization.
Despite the discontinuation of its development, Sourcetrail remains a valuable free resource for code visualization, especially for smaller to medium-sized projects in supported languages. Its intuitive interface and powerful visualization capabilities offer a compelling way to explore and understand codebases, even if it lacks the active support and ongoing updates of commercial alternatives. Tools like Understand and Doxygen offer continued support and a wider range of features, albeit at a cost, making them suitable for large enterprise projects and those requiring the latest language compatibility. However, for developers on a budget or those working with legacy codebases in supported languages, Sourcetrail’s free availability and powerful visualizations make it a worthy contender among code visualization tools. You can download Sourcetrail from https://www.sourcetrail.com/.
5. Code2flow
Code2flow is a specialized code visualization tool that focuses on automatically generating flowcharts from source code. This makes it a powerful tool for developers seeking a clear and concise way to visualize the execution path of their programs. Its ability to support multiple programming languages, including Python, JavaScript, and others, broadens its applicability across various development environments. Code2flow excels at simplifying complex code into digestible flowcharts, enabling developers to understand, debug, and document their code more effectively. Its inclusion in this list of top code visualization tools is warranted due to its unique focus on automated flowchart generation and its utility in clarifying program logic. This focus can significantly improve code comprehension, particularly in projects involving complex or unfamiliar codebases.
One of Code2flow's key strengths is its simplicity. The tool is designed to do one thing well: generate flowcharts. This focused approach allows for a streamlined user experience, making it easy to quickly visualize code logic without grappling with complex software. This makes Code2flow particularly attractive to developers who prioritize efficiency and ease of use in their tooling. Furthermore, its command-line interface (CLI) makes it ideal for automation and integration into existing development workflows. For instance, flowcharts can be automatically generated during build processes, ensuring up-to-date documentation and facilitating continuous integration and continuous delivery (CI/CD) pipelines.
Code2flow is particularly beneficial for documentation purposes. Automatically generated flowcharts can serve as valuable visual aids in code documentation, making it easier for others (or even your future self) to understand the intricate workings of a program. These flowcharts can be exported in various formats, providing flexibility for integration into different documentation platforms and workflows. This automated documentation process eliminates the tedious manual creation of flowcharts, saving developers considerable time and effort.
While Code2flow excels in flowchart generation, its scope is deliberately limited. It primarily focuses on visualizing control flow and does not offer visualizations for other aspects of code, such as data structures or dependencies. For developers requiring more comprehensive code visualization, tools like D3.js or Graphviz, which offer a wider range of visualization options, might be more suitable. However, if the primary goal is clear and concise representation of program logic, Code2flow's specialized focus is a distinct advantage.
Code2flow's simple visual styling options might be seen as a limitation for those requiring highly customized visuals. While the generated flowcharts are clean and functional, the customization options are basic. Tools like PlantUML offer more control over the visual aesthetics of the generated diagrams. However, Code2flow's minimalistic approach prioritizes clarity and readability over visual flair, which can be beneficial in many scenarios, especially when dealing with intricate logic flows.
Another potential drawback is Code2flow’s performance with highly complex code structures. While it handles most codebases effectively, extremely large or convoluted code can sometimes lead to complex, potentially less readable flowcharts. Developers working with such codebases should be aware of this limitation and consider using alternative tools or simplifying their code structure for optimal visualization.
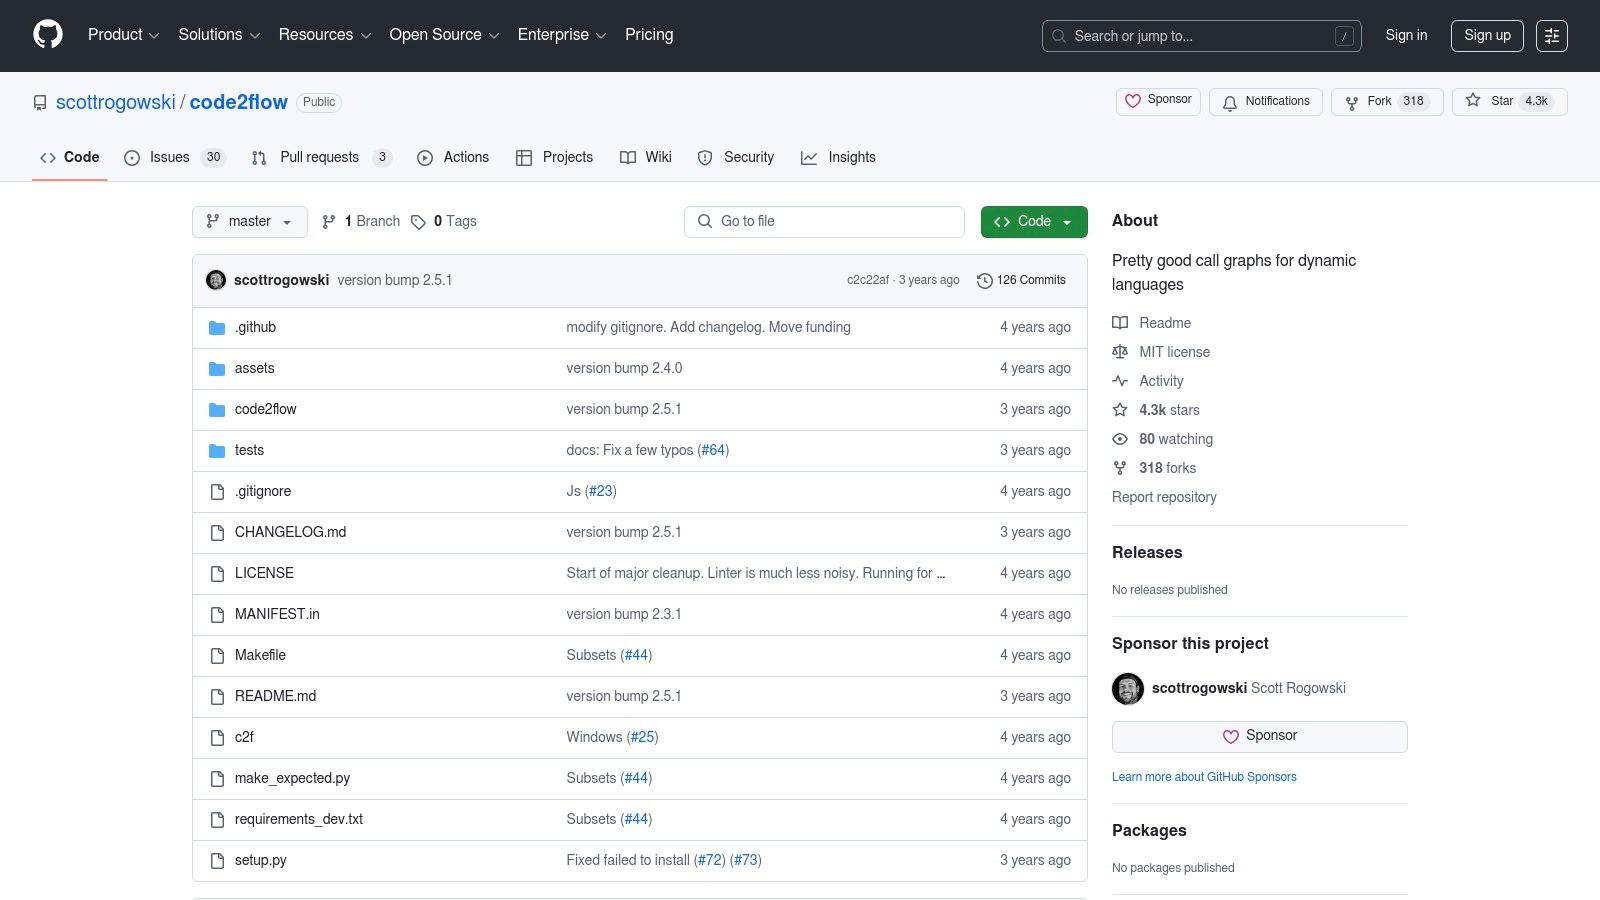
Code2flow is an open-source project hosted on GitHub (https://github.com/scottrogowski/code2flow), meaning it is free to use. Its lightweight nature also minimizes resource consumption. Installation is straightforward via common package managers, further simplifying integration into different development environments. For Python developers, using pip is recommended (pip install code2flow), while Node.js users can leverage npm (npm install -g code2flow). The CLI-based nature allows for seamless integration with build scripts or other automated processes, facilitating automated flowchart generation.
In summary, Code2flow stands out as a practical code visualization tool for developers seeking an efficient and automated way to generate flowcharts. Its simplicity, focus on control flow visualization, command-line interface, and multi-language support make it a valuable addition to any developer’s toolkit. While its limited scope and basic styling might not suit every use case, its focused functionality and ease of use make it an excellent choice for quickly visualizing and documenting program logic.
6. Graphviz
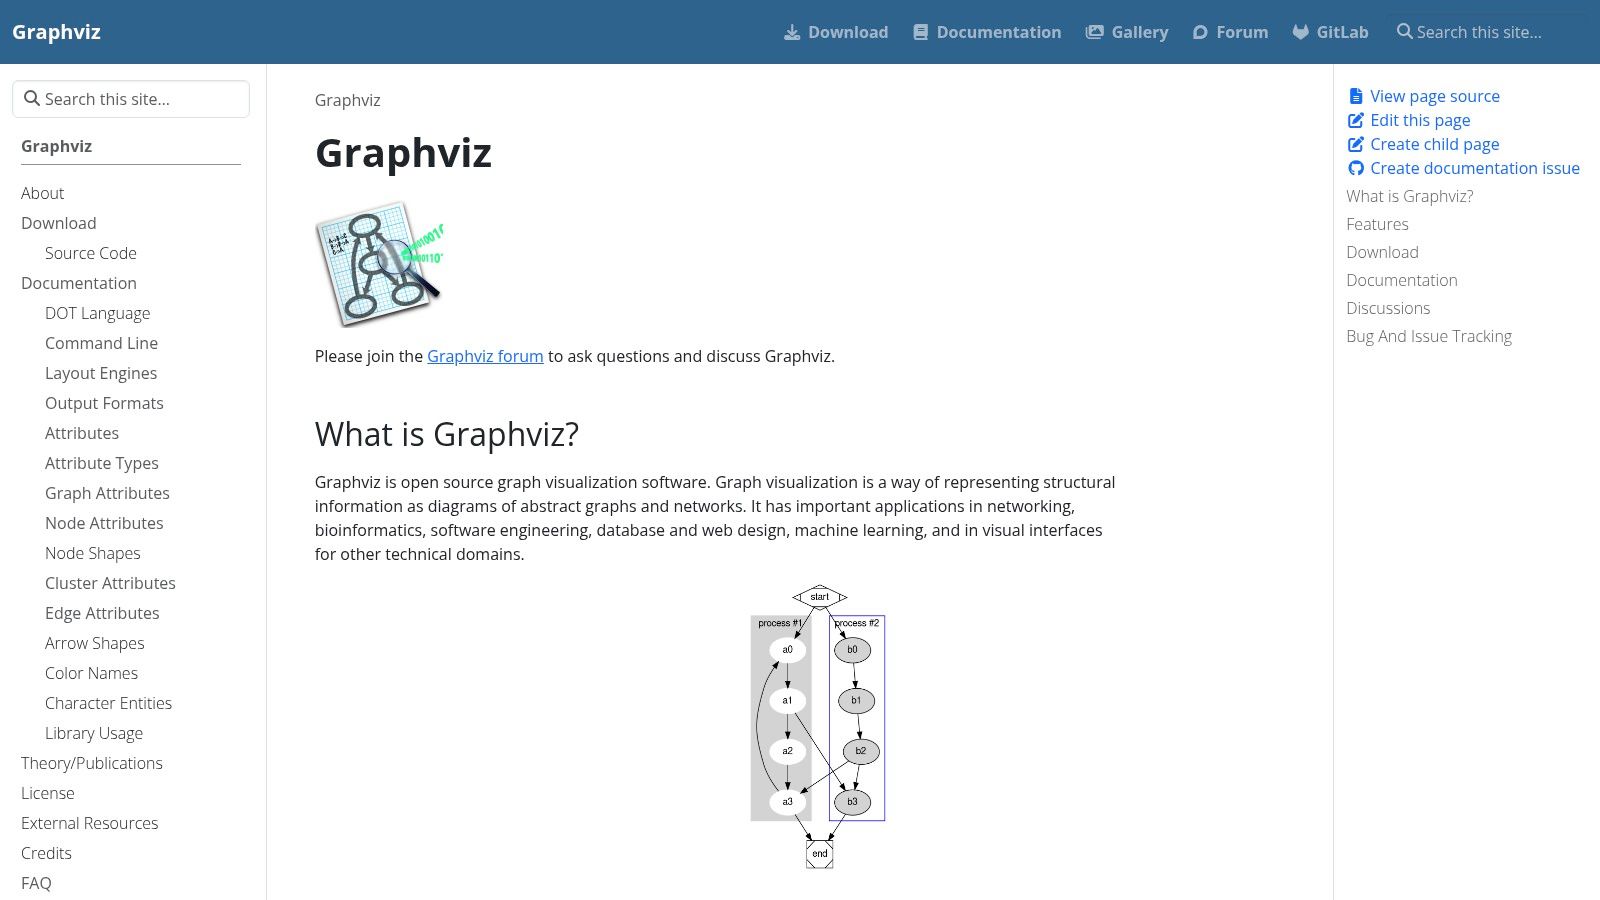
Graphviz, short for Graph Visualization Software, is a powerful open-source tool that holds a unique position among code visualization tools. While not explicitly designed for visualizing code in the same way as dedicated code visualization tools, its flexibility and graph-based approach make it highly adaptable for representing code structure, dependencies, and relationships. This versatility allows developers, DevOps engineers, and data scientists to create visual representations tailored to their specific needs, making it a valuable addition to any technical toolkit. Its ability to handle complex relationships and generate various output formats makes it suitable for a wide range of applications, from documenting software architecture to understanding machine learning model pipelines. If you need a highly customizable and powerful tool for visualizing the interconnectedness within your codebase, Graphviz is an excellent choice.
Graphviz employs a declarative language called DOT, allowing users to describe the desired graph structure textually. This scripting approach provides fine-grained control over node and edge attributes, enabling highly customized visualizations. Several layout algorithms are available, such as hierarchical, radial, and spring-based layouts, each suited to different types of graphs and visualization goals. Whether you’re visualizing a call graph, a dependency tree, or the flow of data within a system, Graphviz offers the algorithms and customization options to create clear and insightful diagrams.
One of Graphviz's key strengths lies in its output flexibility. It supports various output formats, including PNG, SVG, PDF, and PostScript, allowing easy integration into documentation, presentations, and reports. This flexibility extends to styling options, allowing control over colors, fonts, shapes, and other visual elements. This level of customization allows users to create visualizations that adhere to specific branding guidelines or highlight crucial aspects of the code structure being visualized.
Compared to dedicated code visualization tools which often focus on specific programming languages or project structures, Graphviz takes a more general approach. Tools like Sourcegraph or CodeSee are more tightly integrated with codebases and provide features like code navigation and exploration alongside visualization. However, Graphviz's strength lies in its adaptability. You can use it to visualize virtually any graph structure, including those derived from code analysis tools, build systems, or even machine learning pipelines. This makes it a versatile choice for projects that don't fit neatly into the constraints of specialized tools.
Key Features and Benefits:
- Multiple Graph Layout Algorithms: Choose the most suitable layout for your data (e.g., hierarchical, radial, spring-based). This allows tailoring the visualization to the specific type of relationships being represented.
- Scriptable Graph Generation: Define graphs programmatically using the DOT language, enabling automation and dynamic visualization. This allows integrating Graphviz into automated build processes or generating visualizations on-demand.
- Various Output Formats: Export visualizations in various formats (PNG, SVG, PDF, PostScript) for integration into reports, documentation, or presentations. This allows for seamless embedding of visualizations into different workflows.
- Integration with Other Tools: Connect Graphviz with other tools and scripts to automate visualization generation. This can be particularly useful in CI/CD pipelines or for generating visualizations as part of code analysis workflows.
- Customizable Styling: Control the appearance of nodes, edges, and labels to create polished and informative visuals. This allows emphasizing important elements or adhering to branding guidelines.
Pros:
- Highly Flexible and Customizable: Tailor visualizations to specific needs using the DOT language and various styling options.
- Free and Open Source: No licensing costs and community support.
- Excellent Output Quality: Produce high-resolution images in various formats.
- Widely Supported and Integrated: Easily incorporated into various workflows and tools.
Cons:
- Requires Programming/Scripting Knowledge: Familiarity with the DOT language is necessary.
- Not Specifically Designed for Code: Requires preprocessing or integration with code analysis tools.
- Learning Curve for Advanced Features: Mastering the full potential of DOT and layout algorithms takes time.
- Command-line Based: May not be as user-friendly as GUI-based tools.
Implementation/Setup Tips:
- Install Graphviz: Download and install the appropriate package for your operating system from the official website (https://graphviz.org/).
- Learn the DOT Language: Familiarize yourself with the basics of the DOT language to define nodes, edges, and attributes. The official documentation provides comprehensive information.
- Experiment with Layout Algorithms: Try different layout algorithms to find the best visualization for your data.
dot(hierarchical),neato(spring-based), andtwopi(radial) are common choices. - Integrate with Existing Tools: Explore options for integrating Graphviz with your code analysis tools, build system, or other relevant parts of your workflow.
Graphviz’s power lies in its flexibility. While it might require some initial investment in learning the DOT language, its ability to visualize complex relationships and generate high-quality output makes it a valuable tool for software developers, data scientists, and anyone working with complex interconnected systems. Its free and open-source nature, combined with its wide support and integration capabilities, solidifies its position as a vital tool in the code visualization landscape.
7. Gephi
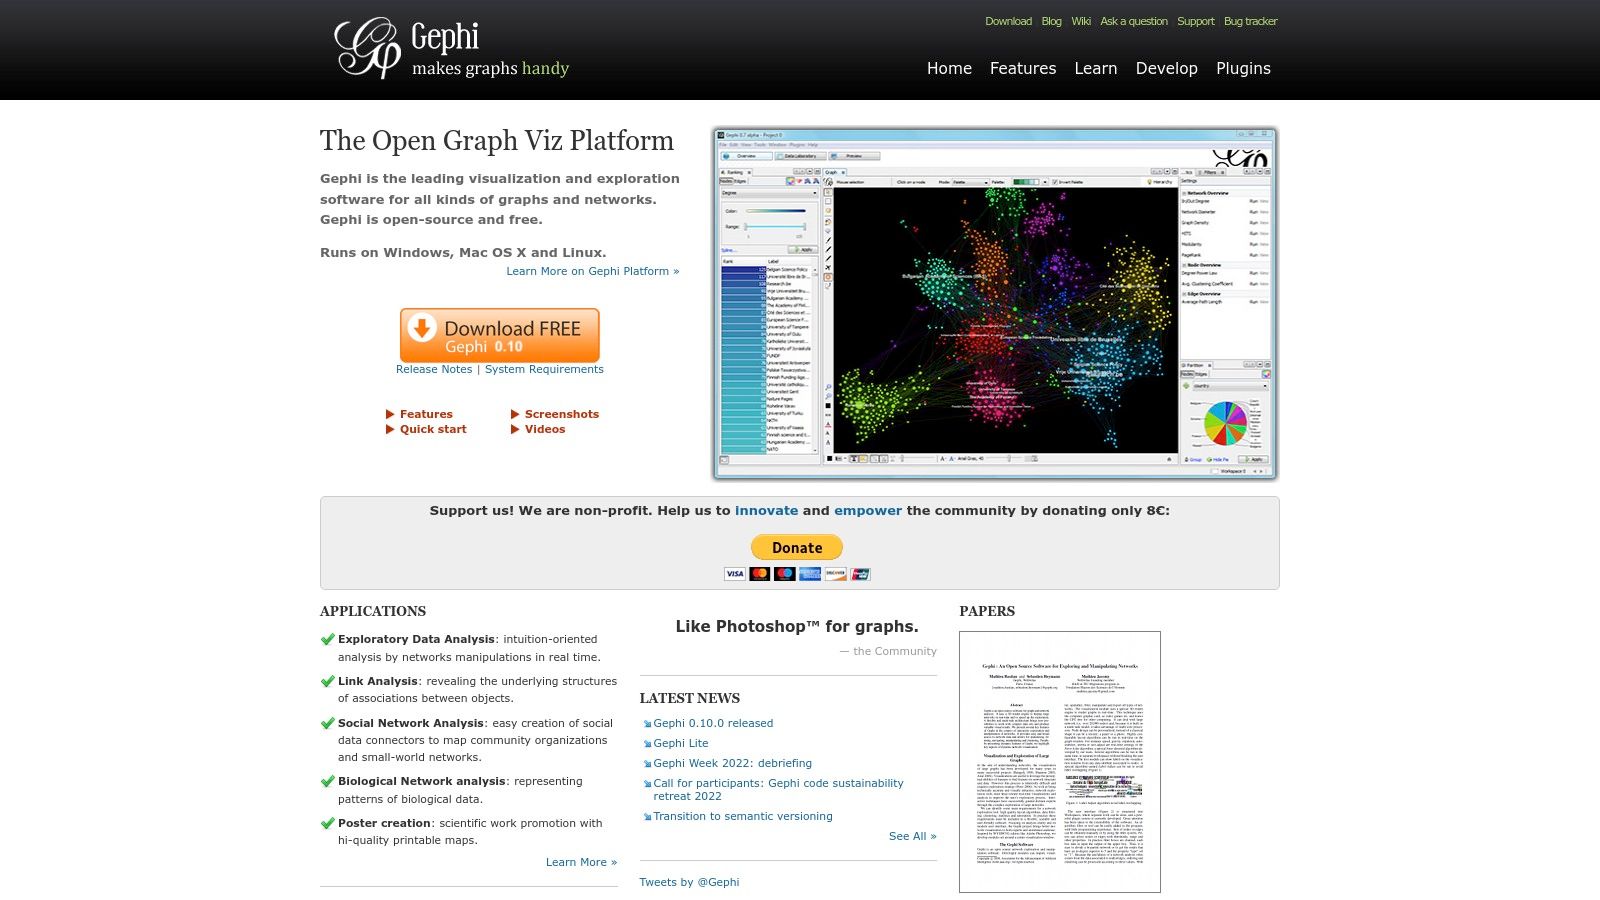
Gephi is a powerful open-source network analysis and visualization tool that, while not specifically designed for code visualization, offers a robust platform adaptable for this purpose. Its strength lies in its ability to handle large-scale networks and dependencies, making it particularly useful for analyzing complex software architectures, dependencies, and codebases at a macro level. While other code visualization tools might excel at representing individual functions or classes, Gephi provides a bird’s-eye view of the entire system, revealing intricate relationships and patterns that might otherwise remain hidden. This makes it an invaluable tool for software developers, architects, DevOps engineers, and technical project managers seeking a deeper understanding of their projects. For data scientists and AI/ML practitioners, Gephi can be used to visualize complex data pipelines, model dependencies, and network structures within data.
Gephi’s interactive network visualization features allow developers to explore their codebase as a network graph, where nodes represent code entities (files, classes, functions, etc.) and edges represent relationships (dependencies, calls, inheritance, etc.). Its statistical analysis tools provide quantitative insights into the code structure, such as identifying central nodes (highly dependent upon modules), detecting modularity, and measuring code complexity. This information can be crucial for refactoring efforts, identifying potential bottlenecks, and improving overall code quality. Dynamic network exploration capabilities allow filtering, highlighting, and manipulating the graph in real-time, enabling developers to isolate specific parts of the system for closer examination. Furthermore, Gephi’s plugin architecture extends its functionality, offering specialized visualizations and analysis techniques. Real-time visualization features can even track changes in the codebase over time, offering insights into the evolution of the software architecture.
One of the biggest advantages of Gephi is its cost-effectiveness. Being free and open-source, it provides a powerful alternative to commercial network analysis software. An active community and a rich ecosystem of plugins further enhance its value, offering continuous development, support, and specialized tools. Gephi also excels at handling large datasets, a critical feature for visualizing extensive codebases.
However, since Gephi isn’t designed specifically for code visualization, using it requires data preprocessing. You'll need to extract the relevant data from your codebase (e.g., using static analysis tools) and transform it into a format suitable for Gephi (typically a graph format like GEXF or GraphML). This preprocessing step can be a hurdle for some users. Furthermore, Gephi’s powerful features can make it overly complex for simple code visualization tasks. Other, more specialized tools might be more suitable for visualizing individual functions or smaller code segments. Lastly, visualizing very large graphs can be memory-intensive and might require powerful hardware.
Compared to tools like CodeSee or Sourcetrail, which are explicitly built for code visualization and offer integrated debugging and code navigation, Gephi focuses on the macro-level structure and dependencies. While CodeSee helps understand the flow within specific functions, Gephi provides insights into the overall architecture and interconnections within the system. Similarly, while Sourcetrail offers code exploration features, Gephi provides a more abstract, network-based representation. This distinction makes Gephi a valuable complement to more specialized code visualization tools, offering a different perspective on the same codebase.
Implementing Gephi for code visualization involves several steps. First, you need to extract the code structure data. Tools like Doxygen or Understand can generate dependency graphs. Then, convert the extracted data into a format Gephi can import (GEXF or GraphML). Once imported, you can utilize Gephi's layout algorithms, visualization options, and analytical tools to explore and analyze the codebase. Numerous tutorials and resources are available online to guide you through this process.
In conclusion, Gephi earns its place among code visualization tools by offering a powerful, free, and flexible solution for analyzing large-scale software networks and dependencies. While not specifically designed for code visualization, its adaptability and extensive feature set make it a valuable asset for software developers, architects, and anyone seeking a high-level understanding of complex codebases. Its capacity to handle vast datasets, coupled with its open-source nature and active community support, makes it a robust choice for tackling intricate code visualization challenges. However, users should be prepared for the data preprocessing step and consider the potential complexity for simpler visualization tasks. You can download Gephi from https://gephi.org/.
8. Codemap
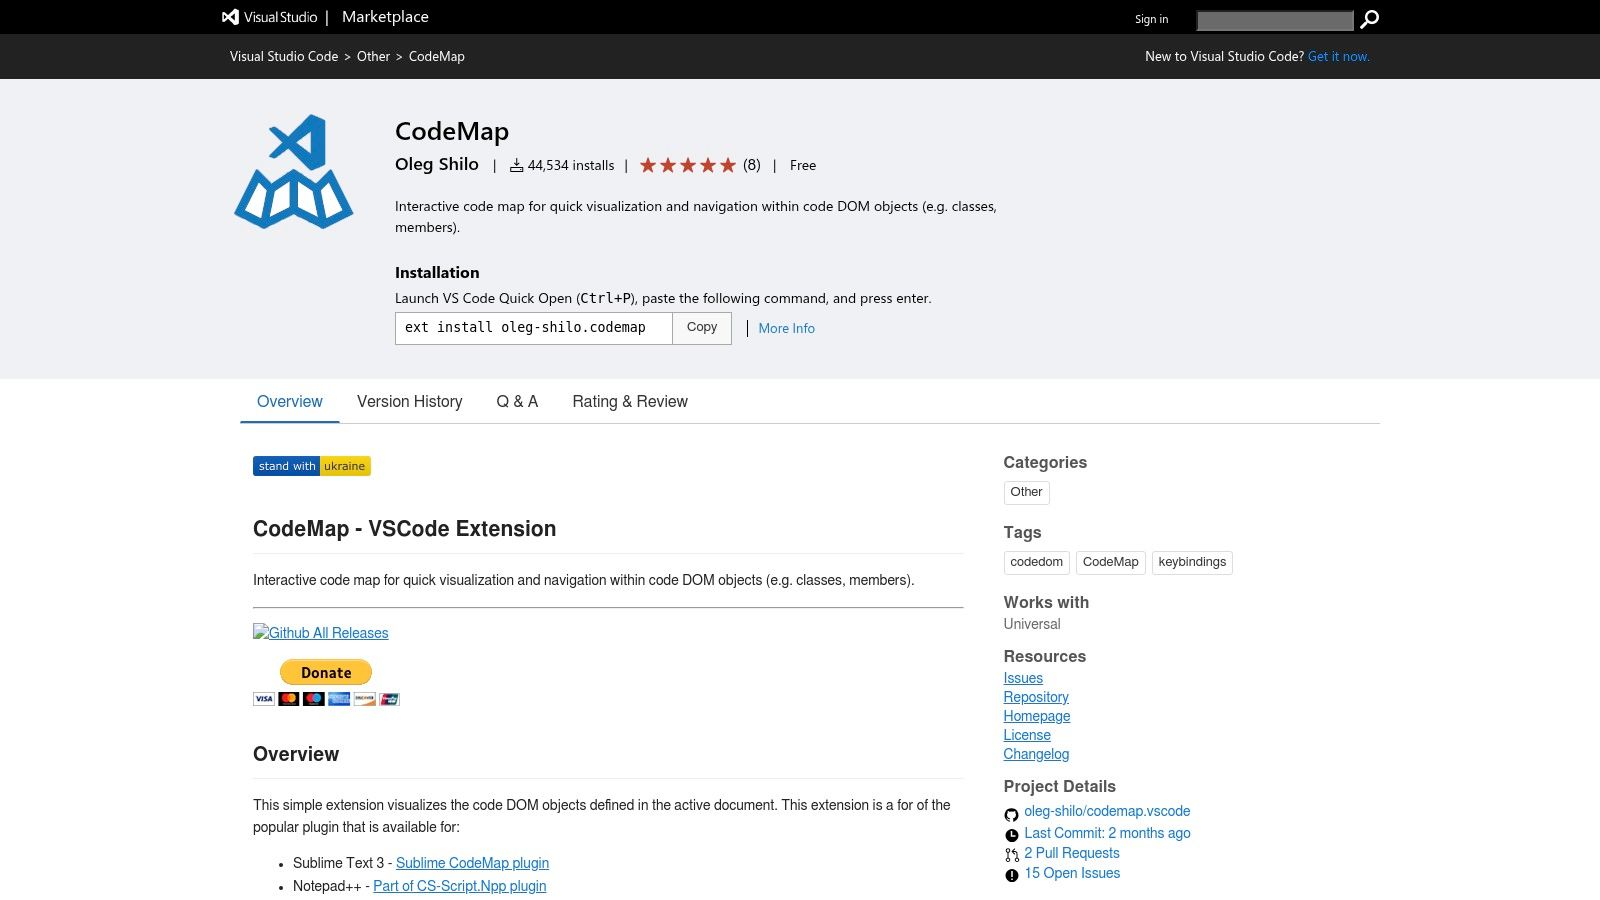
Codemap is a powerful code visualization tool specifically designed as a Visual Studio Code extension. It offers a hierarchical, tree-like overview of your code's structure, making it easier to navigate and understand complex projects. This visualization displays classes, methods, and functions, providing a clear map of your codebase at a glance. Codemap’s integration with VS Code makes it a convenient choice for developers already working within that environment, offering a seamless way to enhance code comprehension without switching between different applications. Its focus on structural representation makes it particularly useful for understanding the relationships between different parts of a project and quickly navigating to specific sections of the code.
For software developers, AI/ML practitioners, DevOps engineers, data scientists, and technical project managers dealing with large and complex codebases, efficient navigation is critical. Codemap addresses this need by providing a visual representation of the code structure, allowing users to grasp the overall architecture and quickly locate specific elements. This visual approach can significantly reduce the time spent searching for specific functions or understanding the relationships between different modules, thereby increasing productivity.
One of Codemap's key features is its hierarchical code structure view. This allows developers to see the overall organization of their project, from top-level modules down to individual functions and methods. This hierarchical representation is invaluable when working on large projects with numerous interconnected components. The symbol filtering and search feature further enhances navigation by allowing developers to quickly find specific elements within the codebase. This is particularly useful when dealing with projects containing thousands of lines of code.
Codemap supports multiple programming languages, making it a versatile tool for diverse development teams. It also offers customizable display options, allowing users to tailor the visualization to their preferences and the specific needs of their project. Quick navigation to code elements is another valuable feature, enabling developers to jump directly to the relevant section of code with a single click, further streamlining the development process.
Among its strengths are its seamless integration with VS Code, eliminating the need to switch between different applications. It's also a free extension, making it accessible to all VS Code users. Its lightweight nature ensures that it doesn't slow down the performance of VS Code, and it’s specifically designed for efficient code navigation.
However, Codemap does have certain limitations. Being a VS Code extension restricts its use to that environment. Compared to more advanced code visualization tools, its visualization features are relatively basic, focusing primarily on structural representation rather than, for instance, dynamic execution flow. Its functionality is dependent on language server support, meaning that its performance and features can vary depending on the language being used. While it offers some display customization, the options are limited compared to some other tools.
Compared to tools like Sourcegraph, which offers advanced code search and intelligence across multiple repositories and code hosts, Codemap is more focused on providing a quick, visual overview within the VS Code environment. Tools like CodeSee provide more advanced visualization options, including interactive diagrams and the ability to visualize code changes over time. However, Codemap’s simplicity and tight integration with VS Code make it a compelling option for developers who prioritize speed and ease of use within their existing workflow.
Implementing Codemap is straightforward. Simply search for "Codemap" in the VS Code extensions marketplace and install it. Once installed, open a code file and the Codemap will automatically generate a visualization of the code structure in a separate panel within VS Code. There are no specific technical requirements beyond having Visual Studio Code installed. The free availability and ease of installation make it a low-barrier-to-entry tool for developers looking to enhance their code navigation within the VS Code environment.
In summary, Codemap earns its place on this list of code visualization tools due to its focused functionality, tight integration with VS Code, and ease of use. While it might not offer the advanced features of some other tools, its simplicity and speed make it a valuable asset for developers seeking a quick and efficient way to navigate and understand their code within the familiar VS Code environment. You can find the extension on the Visual Studio Code Marketplace: https://marketplace.visualstudio.com/items?itemName=oleg-shilo.codemap
9. NDepend
NDepend stands out as a powerful and specialized code visualization tool meticulously crafted for the .NET ecosystem. Unlike broader code visualization tools, NDepend dives deep into the intricacies of .NET applications, providing a comprehensive suite of features designed to analyze, visualize, and ultimately improve the quality and maintainability of your .NET codebase. It empowers development teams to gain a profound understanding of their code's architecture, dependencies, and overall health, enabling data-driven decisions for effective software development. This makes it an indispensable tool for any serious .NET developer.
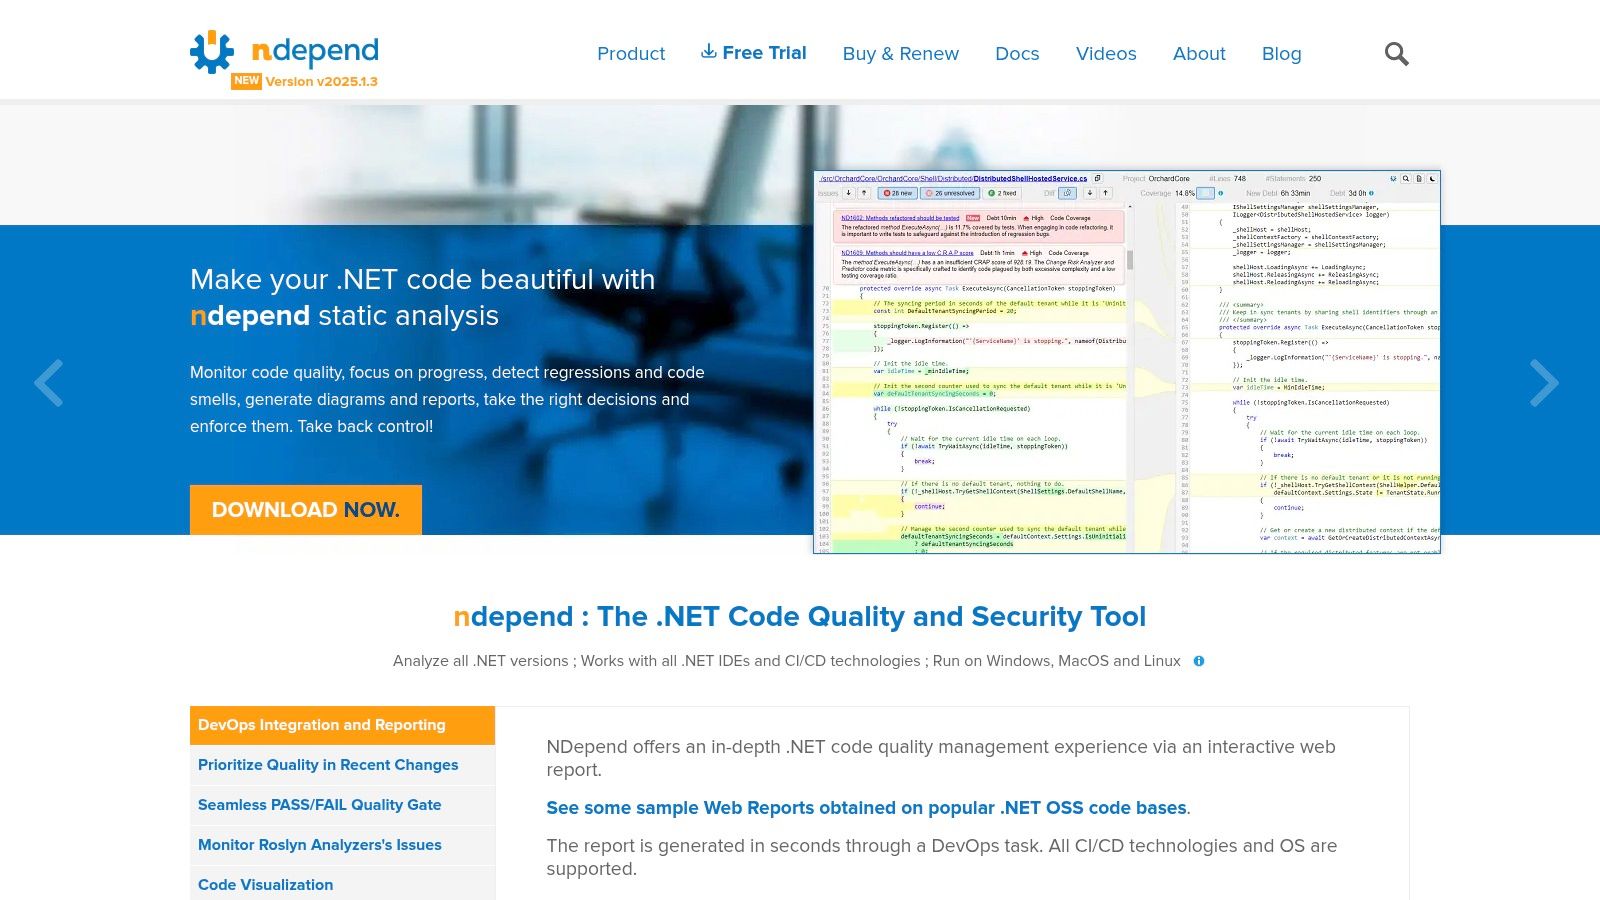
One of NDepend's core strengths lies in its ability to visualize complex dependency relationships. Its dependency structure matrix provides a clear, concise overview of how different modules and components within a .NET application interact, making it easier to identify potential coupling issues and architectural bottlenecks. Interactive graphs and charts further enhance this visualization, allowing developers to explore dependencies in a dynamic and intuitive manner. This is particularly useful for large and complex .NET projects where understanding the interplay of various components is crucial for effective maintenance and evolution.
Beyond dependency visualization, NDepend offers a wealth of code metrics and quality gates. Developers can track key indicators such as code complexity, cyclomatic complexity, and lines of code, enabling them to identify areas that require refactoring or optimization. Quality gates can be established to enforce coding standards and ensure that code quality remains consistent throughout the development lifecycle. These features facilitate proactive identification and resolution of technical debt, ultimately leading to more robust and maintainable applications. For deeper insights into code quality metrics, you can learn more about NDepend and related concepts.
NDepend’s reporting capabilities are also noteworthy. It generates professional-grade reports that provide a comprehensive overview of code quality, dependencies, and technical debt, making it easier to communicate complex technical information to stakeholders. These reports are particularly valuable during code reviews, project planning, and management discussions.
Integration with CI/CD pipelines further streamlines the code analysis process. NDepend can be seamlessly integrated into existing development workflows, providing continuous feedback on code quality and enabling automated code analysis as part of the build process. This fosters a culture of quality and ensures that potential issues are identified and addressed early in the development cycle.
While NDepend's robust feature set makes it a valuable asset for .NET development teams, it's important to consider its limitations. The tool is exclusively designed for the .NET ecosystem, making it unsuitable for projects using other technologies. Furthermore, NDepend's licensing can be expensive, especially for smaller teams or individual developers. Its extensive features can also be overwhelming for beginners, requiring a significant time investment to fully master. Finally, the tool can be resource-intensive, potentially impacting performance on less powerful machines.
Pricing and Technical Requirements:
NDepend offers various licensing options based on the number of users and the desired features. Detailed pricing information can be found on the NDepend website (https://www.ndepend.com/). As for technical requirements, NDepend seamlessly integrates with Visual Studio and supports various .NET frameworks and platforms.
Comparison with similar tools:
Compared to other code visualization tools like SonarQube and Code Climate, NDepend focuses specifically on .NET. While SonarQube and Code Climate offer broader language support, NDepend provides a more in-depth analysis and visualization of .NET-specific features and frameworks. This specialization makes NDepend a preferred choice for teams heavily invested in the .NET ecosystem.
Implementation or Setup Tips:
The easiest way to integrate NDepend is through its Visual Studio extension. After installation, you can directly analyze your .NET solutions from within Visual Studio. NDepend's documentation provides comprehensive guides and tutorials to help users navigate the tool's various features and functionalities. Starting with a smaller project and gradually exploring the different analysis and visualization options can facilitate the learning process. Leveraging the extensive documentation and online resources will help users unlock the full potential of NDepend for their .NET projects.
10. CodeLogic
CodeLogic is an enterprise-grade application intelligence platform designed to provide dynamic code visualization, impact analysis, and architectural insights for large and complex software systems. Unlike many code visualization tools that focus on individual codebases or specific languages, CodeLogic excels at handling the intricacies of sprawling, multi-language enterprise applications. This makes it a powerful tool for organizations struggling to manage and understand their legacy code, dependencies, and the potential impact of changes within their software ecosystem. If you're working on a large-scale project, understanding the interplay of different components is crucial, and that's where CodeLogic truly shines.
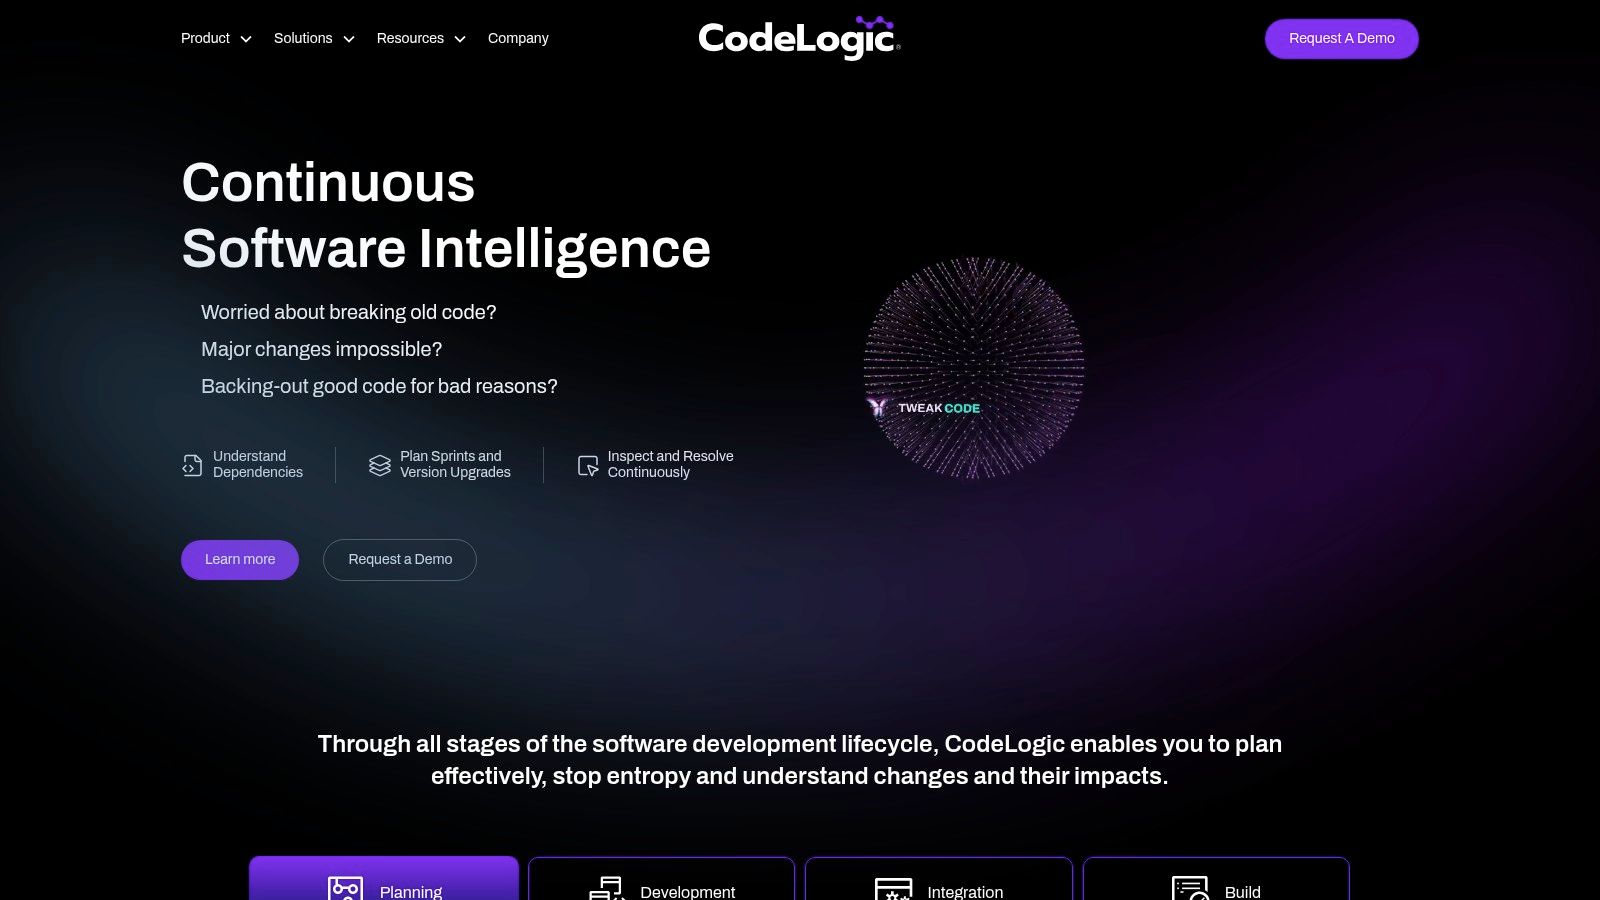
CodeLogic distinguishes itself through its dynamic application mapping capabilities. It automatically generates interactive diagrams that visualize the relationships between different parts of your application, including code components, databases, APIs, and infrastructure elements. These visualizations are not static snapshots; they update in real-time as your code changes, providing a constantly evolving view of your application's architecture. This dynamic mapping makes it significantly easier to understand complex dependencies, identify potential bottlenecks, and assess the impact of proposed changes before they are implemented. Imagine being able to see the ripple effect of modifying a single function across your entire application, saving countless hours of debugging and troubleshooting down the line. This is the power that CodeLogic brings to the table.
One of the key features of CodeLogic is its real-time impact analysis. Developers can quickly and easily assess the potential consequences of code modifications, identifying affected components, dependencies, and potential risks. This allows teams to make more informed decisions during the development process, minimizing the chances of introducing unintended bugs or performance issues. This proactive approach to impact analysis helps shift from reactive firefighting to proactive prevention, saving time and resources. You can learn more about CodeLogic and the benefits of similar static code analysis approaches.
CodeLogic's cross-language support is another significant advantage, especially for enterprise environments with diverse technology stacks. It supports a wide range of programming languages, including Java, C++, Python, .NET, and more. This enables organizations to gain a holistic view of their entire application landscape, regardless of the underlying technologies used. This broad language support reduces the need for multiple, specialized code visualization tools, streamlining the development workflow and providing a consistent view across the entire codebase.
For larger teams, CodeLogic integrates seamlessly with popular development tools, including IDEs and CI/CD pipelines. This integration helps embed CodeLogic into existing workflows, making it easier for developers to access its features and incorporate them into their daily routines. Integration with development tools ensures that code visualization and analysis are not isolated activities but become integral parts of the development lifecycle.
From a security standpoint, CodeLogic includes robust enterprise security features, such as role-based access control and secure authentication mechanisms. These features help ensure that sensitive code information is protected and only accessible to authorized personnel. This is particularly critical in enterprise environments where security and compliance are paramount.
While CodeLogic offers powerful capabilities for enterprise-level code visualization, it also has some drawbacks. The high cost of enterprise licensing can be a barrier for smaller organizations or individual developers. The setup and configuration process can also be complex, requiring dedicated resources and expertise. Moreover, the extensive feature set and infrastructure requirements can be overkill for smaller teams with less complex projects. If you're a small team working on a relatively straightforward application, CodeLogic might be more than you need.
In summary, CodeLogic stands out among code visualization tools due to its enterprise-grade capabilities, real-time analysis, broad language support, and strong security features. While it may not be suitable for all teams due to its complexity and cost, it provides invaluable insights for organizations managing large and complex software systems. Its dynamic mapping and impact analysis features empower developers to understand their code better, make more informed decisions, and ultimately deliver higher-quality software.
Code Visualization Tools Feature Comparison
| Tool | Core Features / Characteristics | User Experience & Quality ★ | Value Proposition 💰 | Target Audience 👥 | Unique Selling Points ✨ |
|---|---|---|---|---|---|
| Visual Studio Code | Minimap, syntax highlighting, extensions, debugging | ★★★★☆ Free & extensible | 💰 Free | Developers seeking versatile, lightweight editor | ✨ Large extension ecosystem, cross-platform |
| CodeSee | Auto codebase mapping, dependency viz, Git integration | ★★★★☆ Intuitive, cloud-based | 💰 Paid with limited free tier | Teams & code reviewers | ✨ Interactive maps, collaboration |
| Understand | Static analysis, metrics, cross-reference, multi-language | ★★★★★ Powerful, professional | 💰 Expensive licensing | Enterprises, legacy codebases | ✨ Deep analysis & reporting |
| Sourcetrail | Interactive exploration, call graphs, cross-language | ★★★☆☆ Intuitive but discontinued | 💰 Free | Developers in need of free explorer | ✨ Open-source, cross-platform |
| Code2flow | Auto flowchart generation, CLI, multi-language | ★★★☆☆ Simple, lightweight | 💰 Free/Open-source | Developers needing flowcharts | ✨ Command-line automation |
| Graphviz | Scriptable graphs, multiple layouts, customizable | ★★★★☆ High output quality, flexible | 💰 Free | Developers/scripters needing custom graphs | ✨ Highly customizable & widely integrated |
| Gephi | Interactive network viz, stats tools, plugins | ★★★☆☆ Powerful but complex | 💰 Free | Data analysts & visualization pros | ✨ Large-scale network analysis |
| Codemap | Hierarchical code tree, symbol search, VS Code extension | ★★★☆☆ Lightweight & fast | 💰 Free extension | VS Code users needing code overview | ✨ VS Code integration, easy navigation |
| NDepend | Dependency matrix, code metrics, CI/CD integration | ★★★★☆ Professional & detailed | 💰 Expensive | .NET developers & enterprises | ✨ .NET focused, technical debt analysis |
| CodeLogic | Dynamic mapping, real-time impact, enterprise security | ★★★★☆ Enterprise-grade | 💰 High cost | Large enterprises | ✨ Real-time analysis, strong security |
Choosing the Right Code Visualization Tool
Selecting the optimal code visualization tool from the array of options available—including Visual Studio Code, CodeSee, Understand, Sourcetrail, Code2flow, Graphviz, Gephi, Codemap, NDepend, and CodeLogic—depends heavily on your specific needs. Key factors to consider include project scale, team size, budget constraints, and the programming languages used. For instance, enterprise-level projects might benefit from the robust features of platforms like CodeLogic or NDepend, which offer comprehensive analysis and visualization capabilities. Smaller teams or individual developers, on the other hand, could find lighter-weight tools like CodeSee or VS Code extensions sufficient for their needs. Speaking of VS Code, if you're already utilizing this versatile editor, exploring its ecosystem can be a great starting point. Beyond its core features, VS Code offers a rich ecosystem of extensions that can further enhance your code visualization capabilities. Check out these helpful resources: VS Code extensions for code visualization. Open-source solutions like Graphviz and Gephi offer flexibility and extensive customization options, particularly appealing to those with the technical expertise to leverage their full potential.
Remember to also consider factors such as integration with your existing development workflow, the learning curve associated with each tool, and the specific types of visualizations offered. Successfully implementing code visualization tools requires careful planning and consideration. Choosing the right tool empowers you to navigate complex codebases, identify potential issues, and improve overall code comprehension, ultimately leading to more efficient development processes and higher-quality software.
Want to take your code visualization to the next level? Explore TreeSnap, a powerful tool designed to help you understand and navigate your codebase with interactive visualizations. Visit TreeSnap today and discover a new dimension of code understanding.