Supercharge Your Code: Choosing the Right Analysis Tool
Want cleaner, more secure, and maintainable code? Code analysis tools are essential for catching bugs, vulnerabilities, and style issues early. This listicle presents 10 powerful code analysis tools—including SonarQube, Code Climate, ESLint, and more—to help you improve code quality and accelerate development. We'll explore options suitable for diverse programming languages and team sizes, plus how TreeSnap can further optimize your code analysis workflow.
1. SonarQube
SonarQube stands as a leading code analysis tool, providing a comprehensive platform for continuous inspection of code quality and security across a wide spectrum of programming languages. It's a powerful solution for developers, DevOps engineers, and technical project managers seeking to improve code maintainability, reliability, and security. By integrating seamlessly into CI/CD pipelines, SonarQube offers real-time feedback and detailed metrics, allowing teams to identify and address issues early in the development lifecycle. Its ability to detect security vulnerabilities and assess technical debt further solidifies its position as an indispensable tool in the modern software development landscape. For those seeking a robust solution for static code analysis, SonarQube offers a compelling blend of features and capabilities, making it a top contender in the realm of code analysis tools.
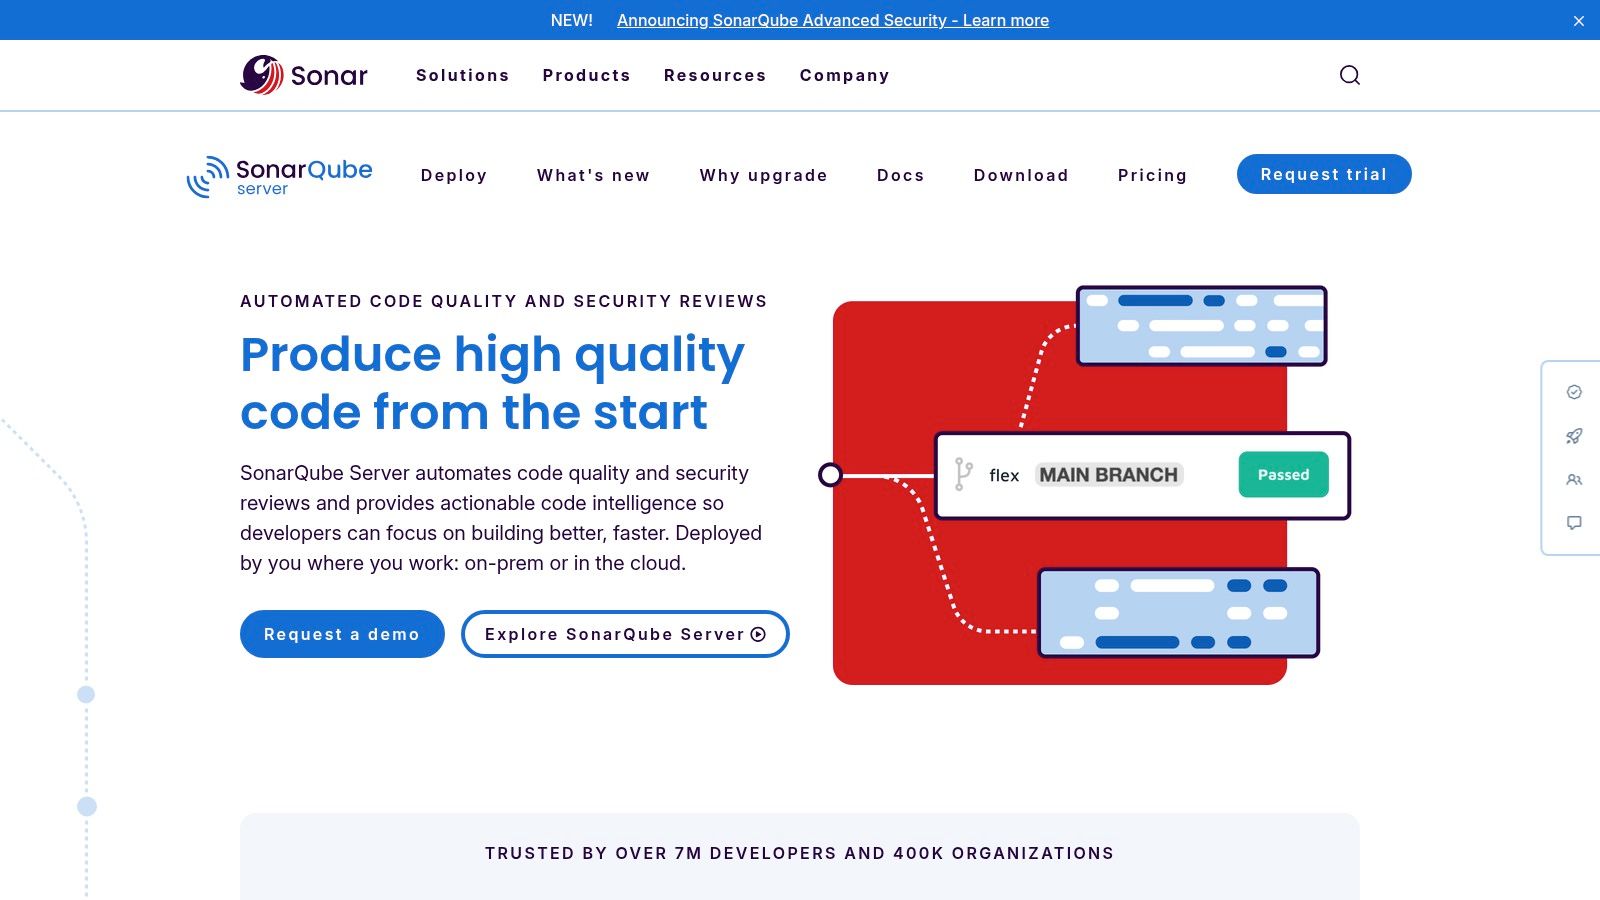
One of SonarQube's major strengths is its multi-language support, covering over 25 programming languages including Java, Python, JavaScript, C++, C#, and more. This broad compatibility makes it suitable for diverse development environments and teams working with multiple technologies. This cross-platform compatibility allows developers to maintain consistent code quality standards across all projects, regardless of the underlying technology. Furthermore, SonarQube's real-time code quality gates ensure that code meets predefined standards before being merged into the main branch, preventing the accumulation of technical debt and improving overall code health. Learn more about SonarQube This integration with CI/CD pipelines automates the code analysis process, providing immediate feedback to developers and promoting a proactive approach to code quality management.
Beyond code quality, SonarQube excels in security vulnerability detection. By adhering to industry standards like OWASP, it helps identify potential security flaws in your codebase, enabling proactive mitigation of risks. This feature is crucial in today's security-conscious development environment, where vulnerabilities can lead to significant breaches and data compromises. In addition to security, SonarQube provides valuable insights into technical debt, including code complexity, code duplication, and potential bugs. This information allows teams to prioritize refactoring efforts and make informed decisions about technical debt management. This holistic approach to code analysis helps teams balance development speed with long-term maintainability and stability.
SonarQube offers both Community and Commercial editions. The Community Edition is free and open-source, ideal for smaller teams and open-source projects. It provides core code analysis features, making it a great starting point for exploring the platform. Commercial editions offer additional features like advanced security analysis, portfolio management, and reporting capabilities, catering to the needs of larger enterprises. While pricing for commercial licenses varies based on the chosen edition and the number of users or lines of code, the free Community Edition offers significant value for smaller teams and projects with limited budgets.
Setting up SonarQube involves installing the SonarQube server and configuring a scanner for your chosen build tool (e.g., Maven, Gradle, Jenkins). While the initial setup can be slightly complex, especially for enterprise deployments with specific integration requirements, the comprehensive documentation provided by SonarQube can guide users through the process. Integrating SonarQube with your CI/CD pipeline involves configuring plugins or scripts to trigger code analysis during the build process. This integration allows for automated code quality checks and ensures that code quality standards are enforced consistently.
Compared to other code analysis tools like Checkstyle or PMD, SonarQube offers a broader range of features, including security analysis and technical debt assessment. While tools like Checkstyle and PMD focus primarily on code style and potential bugs, SonarQube provides a more comprehensive view of code quality and security. This comprehensive analysis helps teams address a wider range of code issues, leading to improved software quality and reduced development costs in the long run.
Pros:
- Comprehensive analysis with detailed reporting dashboards.
- Strong community support and extensive documentation.
- Seamless integration with popular CI/CD tools.
- Free community edition available for smaller teams.
Cons:
- Can be resource-intensive for large codebases.
- Commercial licenses can be expensive for enterprise features.
- Initial setup and configuration can be complex.
- Limited offline analysis capabilities.
SonarQube's comprehensive features, multi-language support, and robust integrations make it a valuable asset in any software development workflow. While the commercial versions can be expensive, the free community edition offers a compelling entry point for teams seeking to improve their code quality and security practices. By providing a centralized platform for code analysis and reporting, SonarQube empowers development teams to proactively address code issues, reduce technical debt, and build more reliable and secure software.
2. CodeClimate
CodeClimate is a powerful, cloud-based automated code review tool designed to help development teams improve and maintain code quality without sacrificing velocity. It provides a comprehensive analysis of your codebase, assessing factors like maintainability, test coverage, and code duplication across various programming languages. Whether you're a small startup or a large enterprise, CodeClimate offers both hosted and on-premise solutions tailored to meet your specific needs, complete with enterprise-grade security features. This makes it a valuable addition to the arsenal of any team striving for robust and efficient software development.
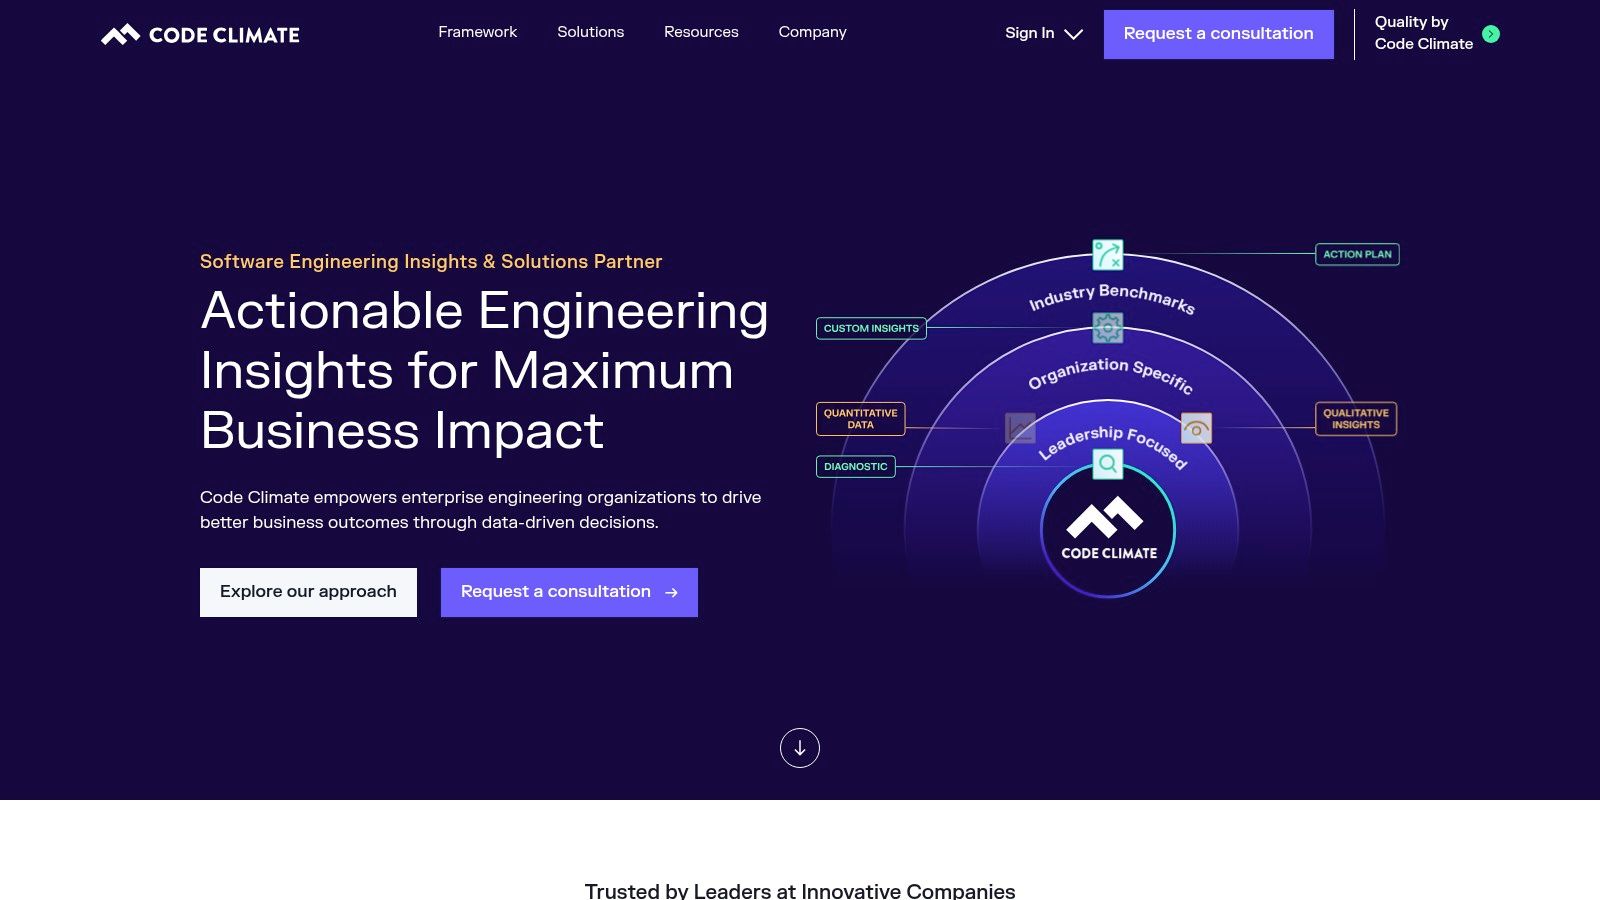
CodeClimate earns its place on this list of top code analysis tools thanks to its blend of robust analysis and a user-friendly experience. Its automated code review process assigns maintainability scores, providing a quantifiable measure of code health. This allows teams to identify potential problems early on, preventing technical debt from accumulating. The platform's ability to track and report test coverage further reinforces its commitment to quality assurance, ensuring your codebase is thoroughly vetted. For data scientists and AI/ML practitioners working with complex codebases, these features are crucial for maintaining model integrity and reproducibility.
A significant advantage of CodeClimate lies in its seamless integration with popular version control systems like GitHub, GitLab, and Bitbucket. This integration facilitates pull request (PR) analysis, allowing for automated code reviews within the developers’ existing workflow. CodeClimate automatically comments on PRs, highlighting potential issues and suggesting improvements directly within the platform. This streamlined approach fosters better collaboration amongst developers, DevOps engineers, and technical project managers, enabling them to address code quality concerns proactively. It also reduces context switching, allowing teams to maintain focus and velocity.
One of the stand-out features of CodeClimate is its ability to quantify technical debt in terms of both time and cost. This provides valuable insights for technical project managers, allowing them to prioritize refactoring efforts and allocate resources effectively. By understanding the financial implications of technical debt, teams can make data-driven decisions about when and how to address it. This feature is particularly relevant for larger organizations where technical debt can significantly impact development timelines and budgets. CodeClimate also provides metrics on team productivity and velocity, offering valuable data for optimizing workflows and improving overall efficiency.
While CodeClimate offers a plethora of benefits, it's essential to consider the potential drawbacks. The platform operates on a subscription-based pricing model, which can be expensive, especially for smaller teams or individual developers. Furthermore, while CodeClimate supports several programming languages, its coverage is less extensive than some of its competitors, which might be a limiting factor for teams working with niche languages. The platform's customization options for analysis rules are also somewhat limited. Finally, as a cloud-based tool, CodeClimate requires a stable internet connection for analysis. If you're working in an environment with limited or unreliable internet access, the cloud-based version might not be the ideal solution. However, the on-premise version mitigates this issue.
Implementation and Setup Tips:
Integrating CodeClimate into your workflow is typically straightforward. The platform provides detailed documentation and excellent customer support to assist with setup and configuration. Here are some tips for a smooth implementation:
- Start with a trial: Explore the features and functionalities during the trial period to assess whether CodeClimate meets your specific needs.
- Prioritize integrations: Connect CodeClimate to your existing version control system (GitHub, GitLab, or Bitbucket) to leverage PR integration and streamline code reviews.
- Configure analysis rules: While customization options are somewhat limited, familiarize yourself with the available rule sets and adjust them to align with your team's coding standards.
- Interpret metrics: Take advantage of the metrics provided by CodeClimate, including maintainability scores, test coverage reports, and technical debt quantification, to identify areas for improvement and track progress.
For developers, DevOps engineers, data scientists, AI/ML practitioners, and technical project managers, CodeClimate offers a valuable set of tools for code analysis and quality assurance. By automating code reviews, tracking technical debt, and providing actionable insights, CodeClimate empowers teams to build better software, faster. While the cost and limited customization options are factors to consider, the overall benefits of improved code quality, reduced technical debt, and increased team velocity often outweigh the drawbacks. You can find more information and get started with CodeClimate at https://codeclimate.com.
3. ESLint
ESLint is a widely adopted open-source static code analysis tool that has become an indispensable asset for JavaScript and TypeScript developers. Its primary function is to scrutinize your codebase for stylistic inconsistencies, potential bugs, and problematic patterns, ultimately enforcing best practices and improving code quality. Unlike dynamic analysis tools that examine code during execution, ESLint operates statically, analyzing the code without actually running it. This allows developers to catch issues early in the development cycle, before they manifest as runtime errors. As a crucial part of the code analysis tools landscape, ESLint contributes significantly to building more robust, maintainable, and error-free JavaScript and TypeScript applications.
One of ESLint's strengths lies in its high configurability. It offers a comprehensive set of predefined rules covering various aspects of JavaScript and TypeScript coding style and best practices. These rules can be customized to fit the specific needs of a project, and developers can also create their own rules to address unique requirements. This flexibility makes ESLint adaptable to diverse coding styles and project conventions. Beyond stylistic checks, ESLint also detects potential programming errors, like unused variables, accidental global variable assignments, and questionable coding patterns that could lead to bugs. This proactive approach to error prevention saves developers valuable debugging time and improves the overall stability of the application.
ESLint boasts an extensive plugin ecosystem, further extending its capabilities. Plugins allow integration with popular frameworks and libraries like React, Vue, and Angular. For React developers, for instance, dedicated ESLint plugins can enforce best practices specific to JSX syntax, component lifecycle methods, and other React-specific patterns. This ensures code consistency and adherence to framework guidelines. Similarly, Vue and Angular developers can leverage plugins tailored to their respective frameworks, streamlining the code analysis process and enhancing development workflows.
Integrating ESLint into the development environment significantly enhances productivity. Most popular code editors and IDEs offer seamless ESLint integration, providing real-time feedback as you write code. This immediate error highlighting helps developers identify and fix issues on the fly, preventing them from accumulating and becoming harder to resolve later. ESLint can also be integrated into Continuous Integration/Continuous Deployment (CI/CD) pipelines, ensuring that code quality checks are automatically enforced during the build process. This automated process promotes consistent code quality across the entire project and prevents regressions.
While ESLint offers a plethora of benefits, it does have some limitations. It primarily focuses on JavaScript and TypeScript and is not suitable for other programming languages. The initial configuration can be somewhat daunting for beginners, given the vast number of rules and customization options. Potential rule conflicts can arise when using multiple plugins, requiring careful configuration to resolve them. However, these drawbacks are often outweighed by the substantial benefits ESLint provides in terms of code quality improvement and developer productivity.
Compared to other JavaScript linters like JSHint and JSLint, ESLint stands out due to its greater flexibility, extensibility, and community support. JSHint offers fewer configuration options and has a smaller plugin ecosystem. JSLint, while being one of the earliest JavaScript linters, is known for its stricter and less configurable ruleset. ESLint's balance of configurability and community support has made it the preferred choice for many developers.
Implementation and Setup:
Getting started with ESLint is straightforward. It can be installed via npm or yarn:
npm install eslint --save-dev
or
yarn add eslint --dev
After installation, you need to configure ESLint by creating an .eslintrc file in your project's root directory. This configuration file defines the rules, plugins, and other settings for your project. ESLint also provides an initialization command that guides you through the setup process:
npx eslint --init
ESLint is a powerful and valuable tool for any JavaScript or TypeScript developer. It's completely free and open-source, available at https://eslint.org. Its ability to enforce coding style, prevent potential errors, and improve code maintainability makes it a crucial component in modern JavaScript and TypeScript development workflows. By incorporating ESLint into your toolkit, you can elevate the quality and consistency of your codebase, leading to more robust and maintainable applications.
4. Checkmarx SAST
Checkmarx SAST (Static Application Security Testing) stands out as a robust code analysis tool specifically designed for identifying security vulnerabilities within source code. This enterprise-grade platform offers comprehensive security analysis, pinpointing potential weaknesses early in the software development lifecycle (SDLC). Its support for over 25 programming languages and seamless integration with various development tools make it a versatile solution for diverse development environments. Checkmarx SAST not only identifies vulnerabilities but also provides detailed remediation guidance, empowering developers to address security concerns efficiently. This proactive approach to security helps organizations minimize risks, comply with industry regulations, and deliver more secure software. The platform's strength lies in its ability to provide actionable insights that translate directly into enhanced code security, making it a crucial asset for security-conscious development teams.

For software developers, AI/ML practitioners, DevOps engineers, data scientists, and technical project managers, incorporating robust code analysis tools into the SDLC is paramount. Code analysis tools help ensure code quality, identify potential bugs, and, crucially, uncover security vulnerabilities. Checkmarx SAST is a prominent player in this space, offering a powerful solution specifically tailored for security analysis. Its inclusion in this list of top code analysis tools is warranted by its advanced capabilities, broad language support, and comprehensive reporting features.
One of the key strengths of Checkmarx SAST lies in its advanced security vulnerability detection capabilities. It excels at uncovering a wide range of vulnerabilities, including SQL injection, cross-site scripting (XSS), and insecure deserialization, across more than 25 programming languages. This broad language support makes it a valuable tool for organizations working with diverse technology stacks. The tool seamlessly integrates with existing development workflows, including IDEs, SCM systems, and CI/CD pipelines, enabling continuous security testing throughout the SDLC. This integration ensures that security is not an afterthought but an integral part of the development process. For a deeper understanding of the benefits of static code analysis, you can learn more about Checkmarx SAST.
Furthermore, Checkmarx SAST goes beyond simply identifying vulnerabilities. It provides developers with detailed remediation guidance, offering actionable steps to fix identified issues. This feature significantly reduces the time and effort required to address security concerns, allowing developers to focus on building secure software. The platform also offers compliance reporting for standards like OWASP and SANS, assisting organizations in meeting industry regulations and demonstrating their commitment to security best practices. Incremental scanning, another valuable feature, allows for faster analysis cycles by focusing on changes made since the last scan, optimizing the development workflow.
While Checkmarx SAST offers a powerful set of features, it's important to be aware of its potential drawbacks. The platform is known for its high licensing costs, which can be a significant barrier for smaller organizations or those with limited budgets. While it excels in security analysis, its focus is primarily on security, with limited functionality for general code quality analysis. Configuring and optimizing Checkmarx SAST can also be complex, requiring specialized knowledge and resources. For large-scale deployments, considerable resources may be needed to manage and maintain the platform effectively.
Compared to other SAST tools, Checkmarx distinguishes itself through its comprehensive security analysis, low false-positive rates, and excellent enterprise support. While alternative solutions may offer broader code quality analysis or lower price points, Checkmarx SAST remains a top contender for organizations prioritizing robust security testing.
For implementation, ensure adequate resources are allocated for setup, configuration, and training. Integrate Checkmarx SAST early in the SDLC to maximize its benefits and establish a proactive security posture. Leveraging the platform's incremental scanning capabilities can significantly optimize analysis cycles. While specific pricing and technical requirements aren't readily available, contacting Checkmarx directly can provide tailored information based on your organization's specific needs.
In conclusion, Checkmarx SAST earns its place among top code analysis tools due to its powerful security-focused features, comprehensive reporting, and integration capabilities. While the cost and complexity may be considerations, its ability to identify and remediate security vulnerabilities early in the SDLC makes it an invaluable asset for organizations prioritizing secure software development.
5. Veracode Static Analysis
Veracode Static Analysis stands out among code analysis tools for its comprehensive, cloud-based approach to application security. It's particularly well-suited for organizations with stringent security requirements and complex development environments, offering a robust platform for identifying and mitigating vulnerabilities without requiring direct access to source code. This makes it a powerful tool for ensuring secure software development lifecycles, especially beneficial for businesses working with external development teams or utilizing third-party libraries. Its focus on binary and bytecode analysis sets it apart from many code analysis tools that operate solely on source code, providing a broader scope of vulnerability detection. For organizations prioritizing security and compliance, Veracode Static Analysis is a valuable asset in building and maintaining secure applications.

One of the key advantages of Veracode Static Analysis is its ability to perform deep scans without requiring organizations to share their source code. This is crucial for businesses with sensitive intellectual property or those operating in regulated industries where code confidentiality is paramount. Instead of uploading source code, developers can submit compiled binaries or bytecode for analysis, ensuring secure code review without compromising intellectual property. This feature also simplifies the integration of Veracode into existing development workflows as it doesn't disrupt established code management processes.
Veracode's policy-based scanning feature allows security teams to tailor scans to their specific needs and compliance requirements. Customizable security policies enable organizations to prioritize certain vulnerability types, define acceptable risk thresholds, and align with industry-specific regulations. This ensures that the analysis focuses on the most critical security concerns relevant to the organization's context.
The platform boasts a comprehensive vulnerability database, constantly updated with the latest threat intelligence. This means Veracode Static Analysis can identify a wide range of vulnerabilities, from common coding errors like SQL injection and cross-site scripting to more complex security flaws. This extensive database, coupled with advanced analysis techniques, provides development teams with the information they need to address security risks effectively.
Veracode provides developer-friendly reporting with clear remediation guidance. Vulnerability reports are designed to be easily understood and actionable, offering specific recommendations for fixing identified issues. This empowers developers to address security concerns directly within their workflows, fostering a proactive approach to security throughout the software development lifecycle.
Veracode offers an API-first architecture, enabling seamless integration with various development tools and CI/CD pipelines. This allows for automated security testing as part of the build process, ensuring that security is baked into every stage of development. This integration streamlines security practices, reducing the friction often associated with incorporating security tools into existing workflows.
While Veracode provides substantial benefits, it's important to consider its potential drawbacks. The platform utilizes a premium pricing model, making it potentially less accessible for smaller teams or startups with limited budgets. Additionally, as a cloud-only solution, Veracode might not meet the stringent security requirements of certain organizations that mandate on-premise solutions due to regulatory or internal policies. Furthermore, the level of customization available for analysis rules may be limited compared to some open-source alternatives. Finally, scan times can be longer compared to some competitors, which could potentially impact development velocity.
For organizations seeking robust application security testing without the need to share source code, Veracode offers a compelling solution. Its cloud-based platform, comprehensive vulnerability database, and developer-friendly reporting make it a valuable code analysis tool for enterprises, particularly those operating in highly regulated industries. However, organizations should carefully weigh the premium pricing and cloud-only nature of the platform against their specific needs and budget constraints. For more information, visit the Veracode website.
6. SpotBugs
SpotBugs is a powerful, free, and open-source static code analysis tool specifically designed for Java. As the successor to FindBugs, it carries forward a rich legacy of bug detection capabilities, making it an invaluable asset in any Java developer's toolkit. It leverages static analysis techniques to identify a wide range of potential issues within your Java codebase without actually executing the program. This makes SpotBugs an efficient and proactive approach to improving code quality and reducing the risk of runtime errors. By incorporating SpotBugs into your development workflow, you can address vulnerabilities early in the development lifecycle, saving valuable time and resources that would otherwise be spent on debugging later. This focus on early bug detection makes it a worthy inclusion in any list of essential code analysis tools.
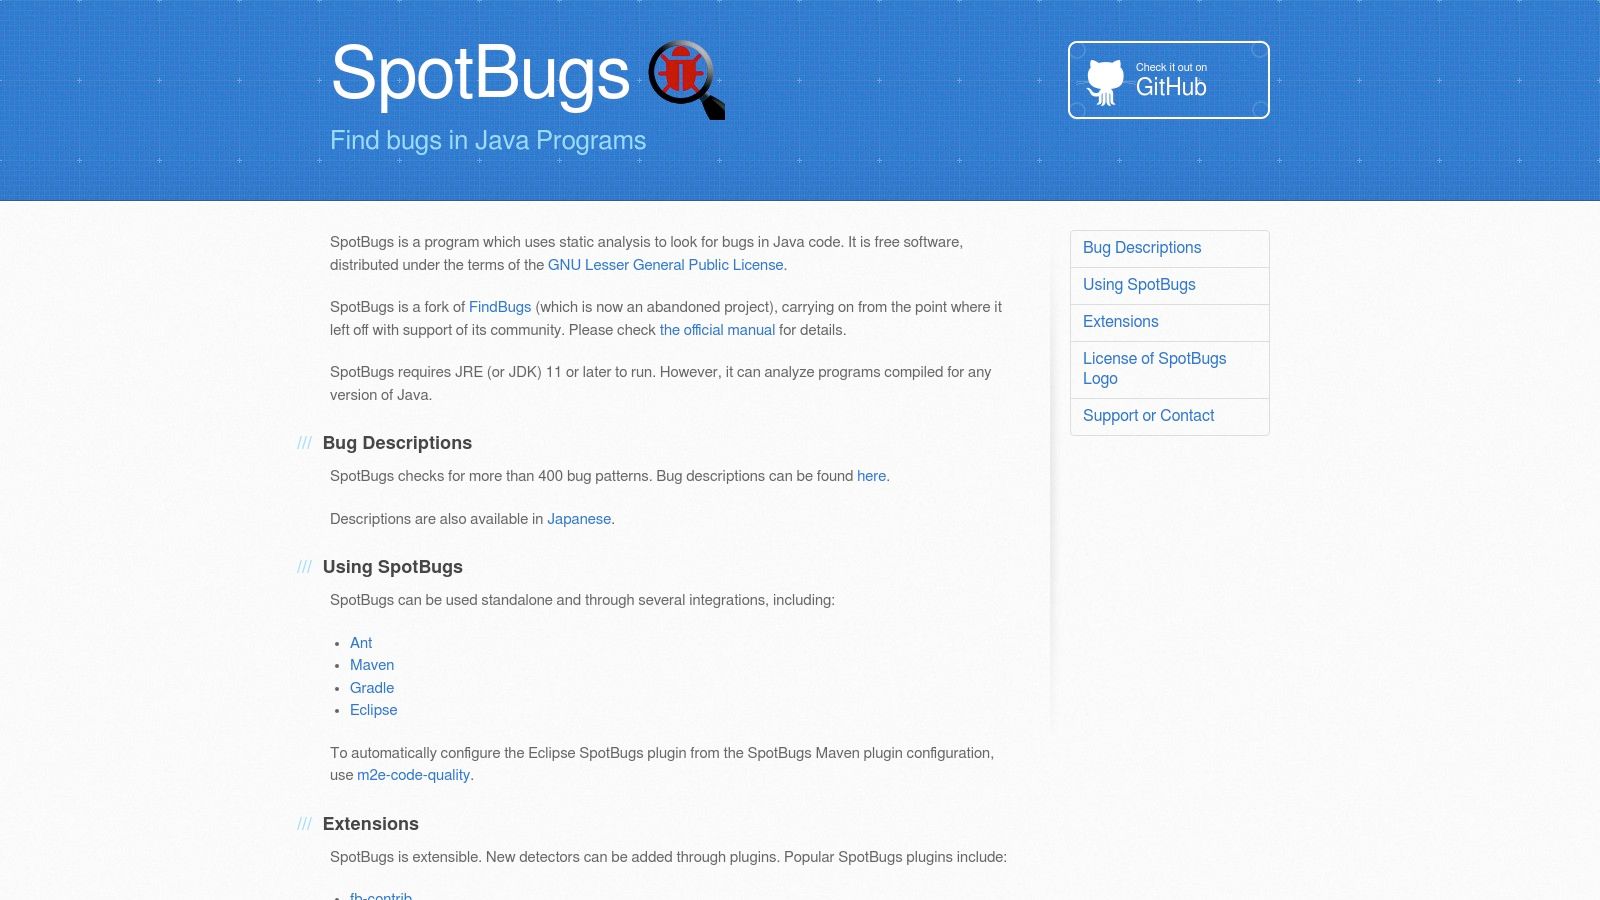
SpotBugs scans Java bytecode, searching for patterns that indicate potential bugs. It boasts an impressive catalog of over 400 distinct bug patterns, covering a spectrum of issues such as null pointer dereferences, infinite recursive loops, inefficient use of the Java libraries, concurrency bugs, and incorrect resource handling. These comprehensive checks help developers identify and rectify coding errors that might otherwise lead to unexpected application behavior, crashes, or security vulnerabilities.
One of SpotBugs' major strengths is its seamless integration with popular development environments and build tools. Whether you're using Eclipse, IntelliJ IDEA, or NetBeans, SpotBugs plugins are available to provide real-time feedback within your IDE as you code. This immediate feedback loop promotes better coding practices and facilitates rapid bug fixing. Furthermore, SpotBugs integrates smoothly with build tools like Maven, Gradle, and Ant, enabling automated code analysis as part of your continuous integration/continuous delivery (CI/CD) pipeline. This integration ensures that code quality checks are consistently applied and potential regressions are caught early.
SpotBugs' extensibility through its plugin architecture allows developers to create custom bug detectors tailored to their specific needs and coding standards. This flexibility enables organizations to extend SpotBugs' capabilities beyond the pre-defined bug patterns and address project-specific vulnerabilities. Moreover, SpotBugs provides various output formats, including XML, HTML, and text, allowing developers to easily analyze and share the analysis results.
Benefits of using SpotBugs:
- Early Bug Detection: Identify potential problems during development, preventing them from becoming costly issues later.
- Improved Code Quality: Enforce coding best practices and improve overall code maintainability.
- Reduced Development Costs: Minimize time spent on debugging and troubleshooting.
- Seamless Integration: Integrate easily with your existing development workflow and CI/CD pipeline.
- Customizable and Extensible: Tailor bug detection to your specific project requirements.
Comparison with similar tools:
While other code analysis tools like PMD and Checkstyle also provide valuable static analysis capabilities for Java, SpotBugs differentiates itself by its focus on bug detection rather than just coding style. While there can be some overlap, SpotBugs' strength lies in identifying potentially harmful logic errors rather than simply enforcing coding conventions.
Implementation and Setup Tips:
Getting started with SpotBugs is straightforward. Download the appropriate plugin for your IDE or configure it within your build tool (Maven, Gradle, Ant). After a quick setup, you can initiate scans and review the reported issues. Pay attention to the severity levels of the detected bugs and prioritize fixing the most critical ones.
Pros:
- Completely free and open-source
- Excellent Java-specific bug detection capabilities
- Strong community support and active development
- Easy integration with existing Java development workflows
Cons:
- Java-only support, unsuitable for other languages
- Can produce false positives, requiring manual review
- User interface could be more modern and intuitive
- Limited security vulnerability detection compared to some commercial tools.
Website: https://spotbugs.github.io
SpotBugs represents a valuable addition to any Java developer's arsenal of code analysis tools. Its ability to detect a wide range of potential bugs early in the development cycle, coupled with its seamless integration and free availability, makes it a compelling choice for improving code quality and reducing development costs. While it's not a one-size-fits-all solution and may require some manual review to address false positives, its strengths in Java-specific bug detection make it a highly recommended tool for enhancing the robustness and reliability of your Java applications.
7. Pylint
Pylint is a powerful static code analysis tool specifically designed for Python. It acts as a meticulous code inspector, scrutinizing your Python projects for potential bugs, style inconsistencies, and code smells that could impact maintainability and performance. Unlike linters that primarily focus on style, Pylint delves deeper into the code structure, analyzing its complexity and adherence to best practices. This comprehensive analysis helps developers identify and rectify issues early in the development cycle, ultimately leading to cleaner, more robust, and more efficient Python code. Its focus on PEP 8 compliance, customizability, and detailed reporting make it an invaluable asset for individual developers and teams striving for high-quality Python code. This tool earns its spot on this list due to its depth of analysis, Python-specific capabilities, and extensive configurability, making it a staple for ensuring code quality in Python projects.
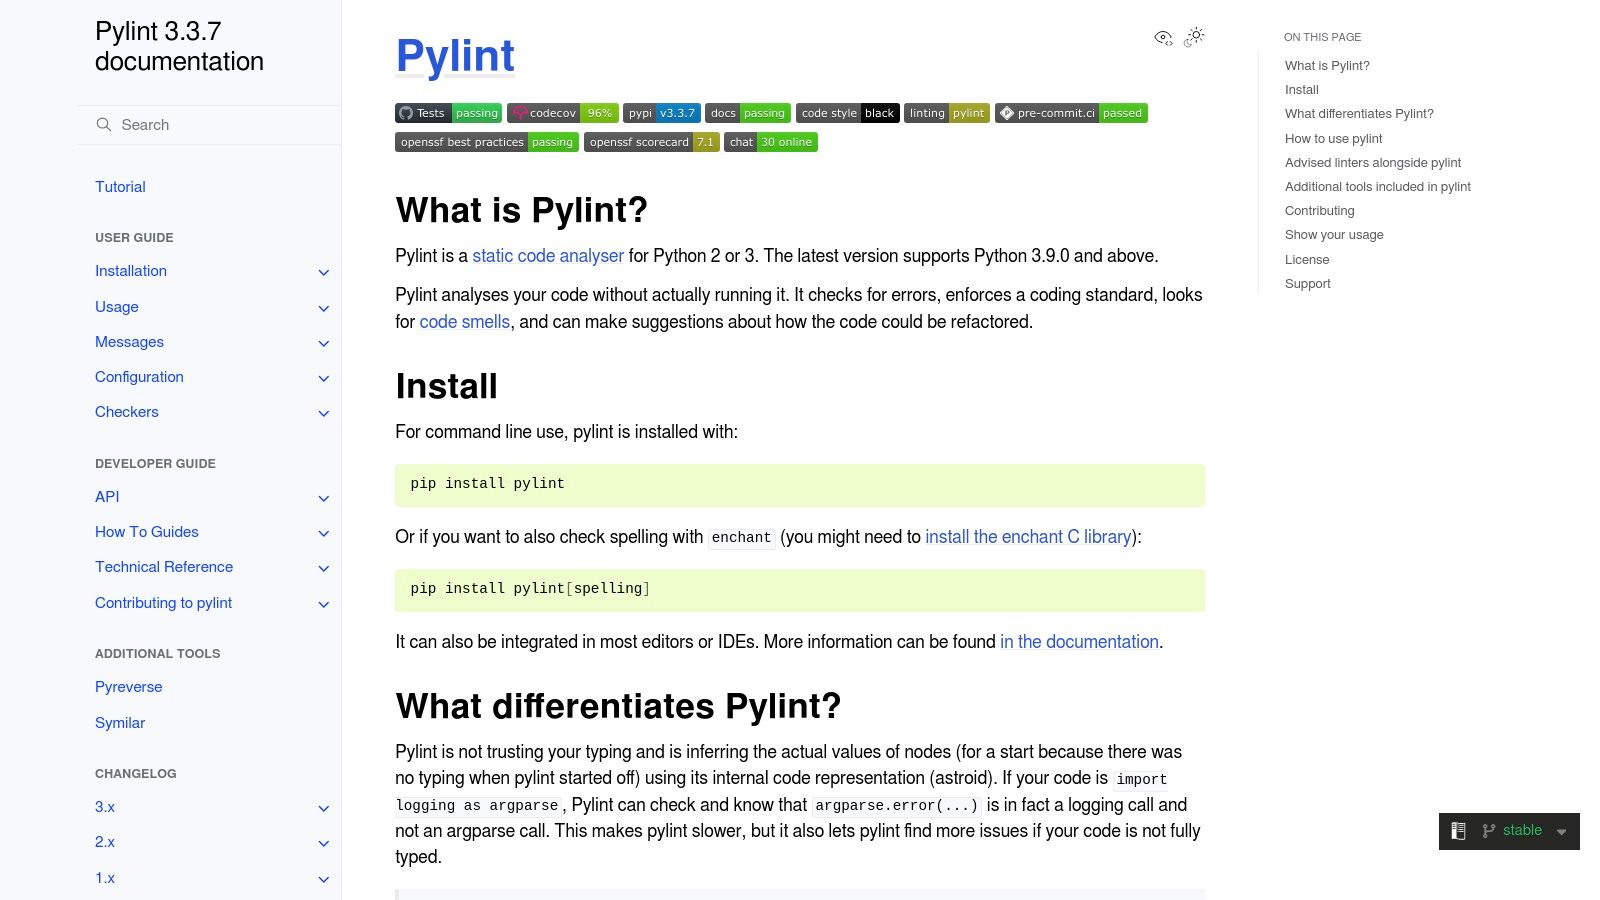
Pylint's feature set makes it a valuable tool for various use cases. For instance, during development, Pylint can be integrated with IDEs like VS Code, PyCharm, and Atom, providing real-time feedback as code is written. This immediate feedback loop helps catch errors and style violations early, preventing them from propagating through the codebase. In continuous integration and continuous delivery (CI/CD) pipelines, Pylint can be employed as a quality gate, ensuring that code meets predefined standards before being merged or deployed. This automated quality control prevents regressions and maintains code quality across the project lifecycle. Furthermore, Pylint can be instrumental in enforcing coding standards within teams. Its configurable rules allow teams to customize the tool to their specific requirements, fostering consistency and readability across the codebase.
Key features that set Pylint apart include its comprehensive Python code analysis and error detection, going beyond basic syntax checking to analyze code structure and logic. Its stringent adherence to PEP 8, the official style guide for Python code, helps developers write more readable and maintainable code. Crucially, Pylint is highly configurable, allowing developers to tailor the rules to their specific needs and even develop custom checkers for unique project requirements. This flexibility makes Pylint adaptable to diverse coding styles and project conventions. Pylint seamlessly integrates with various editors, IDEs, and CI/CD pipelines, making it a versatile tool that fits into existing development workflows. Finally, its detailed reporting, complete with quality metrics and scoring, provides valuable insights into the overall health and quality of the codebase. You can learn more about Pylint and code optimization techniques in our related article.
Pylint is a free and open-source tool with an active community providing support and ongoing development. This ensures that the tool stays relevant and up-to-date with the evolving Python ecosystem. The comprehensive Python-specific analysis capabilities of Pylint are a significant advantage for Python developers. While other code analysis tools offer generic checks, Pylint’s understanding of Python nuances provides more accurate and relevant feedback. The highly configurable nature of Pylint enables teams to tailor the tool to their specific requirements, promoting consistency and adherence to established coding standards. Excellent documentation and numerous learning resources make it easy to get started with Pylint and leverage its full potential.
While Pylint boasts a range of advantages, it also has limitations. Its Python-only support restricts its use in multi-language projects. Out of the box, Pylint can be overly strict and generate a large volume of warnings, requiring time and effort to fine-tune the configuration. Customizing Pylint for advanced use cases can involve complex configurations, which can present a learning curve for some users. Finally, on large Python codebases, Pylint's performance can be slow, potentially impacting development workflows.
To get started with Pylint, install it using pip: pip install pylint. Basic usage involves running pylint <your_python_file.py>. For integration with IDEs and CI/CD pipelines, consult the official Pylint documentation for specific instructions. Pylint's official website (https://pylint.pycqa.org) provides comprehensive documentation, tutorials, and examples.
Compared to tools like Flake8, which primarily focuses on style and simpler error detection, Pylint offers a deeper level of analysis, addressing code structure and complexity. While MyPy focuses specifically on type checking in Python, Pylint covers a wider range of code quality aspects. This makes Pylint a more comprehensive solution for overall code quality improvement, whereas other tools might serve a more niche purpose.
8. CodeGuru Reviewer
Amazon CodeGuru Reviewer is a powerful code analysis tool that leverages machine learning to provide automated code reviews and identify potential defects, security vulnerabilities, and areas for improvement. It's designed to integrate seamlessly within the AWS ecosystem and offers a pay-per-use model, making it an attractive option for teams already utilizing AWS services. CodeGuru Reviewer's intelligent analysis goes beyond simple linting, offering insights derived from a vast dataset of code and best practices, allowing developers to catch issues early and improve the overall quality of their code. This positions it as a valuable addition to the arsenal of any development team focused on building robust and secure applications.
CodeGuru Reviewer shines in its ability to detect hard-to-find issues, going beyond simple syntax errors. Its machine learning algorithms are trained on a massive dataset of open-source projects and Amazon's own codebase, enabling it to identify complex issues related to concurrency, resource leaks, input validation, and security best practices. For example, it can detect potential SQL injection vulnerabilities, cross-site scripting (XSS) flaws, and improper authentication mechanisms. Furthermore, it provides recommendations for improving code performance and adherence to AWS best practices. This makes CodeGuru Reviewer a valuable tool for not only enhancing code quality but also ensuring security and optimizing performance within the AWS environment.
One of the most significant advantages of CodeGuru Reviewer is its seamless integration with existing development workflows. It integrates directly with popular source code management platforms like GitHub, GitHub Enterprise, and AWS CodeCommit. This allows developers to receive automated code reviews during pull requests, directly within their familiar development environment. This tight integration minimizes disruptions to the development process and fosters a proactive approach to code quality.
CodeGuru Reviewer operates on a pay-per-use pricing model, meaning you only pay for the lines of code analyzed. This makes it a cost-effective solution, especially for smaller projects or teams with fluctuating code review needs. There are no upfront costs or licensing fees, and you can easily scale your usage based on your requirements. Further bolstering its cost-effectiveness is the fact that it requires no dedicated infrastructure setup or maintenance. Being a fully managed service, AWS handles all the backend complexities, allowing developers to focus solely on their code.
However, CodeGuru Reviewer does have some limitations. Currently, it primarily supports Java and Python, which might restrict its applicability for teams working with other languages. Additionally, as a cloud-based service, it requires an AWS account and introduces a cloud dependency. While this integrates well within the AWS ecosystem, it might not be suitable for organizations with strict on-premises requirements. Furthermore, compared to some traditional static analysis tools, CodeGuru Reviewer offers less customization in terms of rule configuration. Finally, as a relatively newer service, it has a smaller community and fewer readily available resources compared to more established code analysis tools.
Implementing CodeGuru Reviewer is relatively straightforward, especially for projects already hosted on GitHub or AWS CodeCommit. Associating your repository with the service is a simple process through the AWS console. Once connected, CodeGuru Reviewer automatically analyzes code changes during pull requests and provides feedback directly within the platform. The recommendations are presented clearly and concisely, often including code snippets illustrating the suggested improvements. Developers can then review these recommendations, discuss them with their team, and implement the necessary changes directly within their development workflow.
For teams operating within the AWS ecosystem and primarily using Java or Python, CodeGuru Reviewer represents a compelling choice for enhancing code quality, improving security, and fostering best practices. Its intelligent, ML-powered analysis, seamless integration with existing workflows, and pay-per-use pricing model make it a valuable asset for development teams striving to deliver robust, secure, and high-performing applications. While the language support is currently limited, the service is continuously evolving, and its capabilities are expected to expand over time, making it a code analysis tool worth keeping an eye on. You can explore its features and pricing details further on the official website: https://aws.amazon.com/codeguru
9. PVS-Studio
PVS-Studio stands out as a robust commercial static code analysis tool specifically designed for identifying bugs and security vulnerabilities within C, C++, C#, and Java source code. Its strength lies in its ability to perform deep code analysis, particularly beneficial for large-scale enterprise applications where code quality and reliability are paramount. PVS-Studio distinguishes itself through its advanced dataflow analysis, interprocedural analysis, and a demonstrably low false-positive rate, ensuring that developers focus on genuine issues rather than chasing shadows. This focus on accuracy makes it a valuable asset in ensuring the production of high-quality, secure software. Its place in this list is solidified by its targeted approach towards tackling complex codebases and providing actionable insights for developers working on mission-critical systems.

One of PVS-Studio's key features is its support for multiple programming languages, covering C, C++, C#, and Java. This multi-language support makes it a versatile tool for teams working across different platforms and codebases. For C and C++ developers, especially in enterprise environments, PVS-Studio provides exceptional value due to its deep understanding of these languages and their associated nuances. Furthermore, its integration with popular Integrated Development Environments (IDEs) like Visual Studio and Eclipse streamlines the development workflow, enabling developers to identify and address code issues directly within their preferred coding environments. The incremental analysis capability allows for faster development cycles by focusing only on the modified parts of the code during analysis, optimizing the process and saving valuable time.
The benefits of using PVS-Studio are numerous. The tool boasts excellent detection accuracy with minimal false positives, minimizing wasted time and effort. This high accuracy is especially critical in complex projects where tracking down genuine issues can be challenging. PVS-Studio provides comprehensive documentation and responsive customer support, aiding users in maximizing the tool's potential and resolving any encountered issues effectively. Regular updates with new detection rules ensure that the tool stays abreast of the latest coding standards and emerging vulnerabilities. The comprehensive reporting features, including code quality metrics, empower teams to monitor and improve their codebase over time, contributing to overall software quality and maintainability.
While PVS-Studio offers compelling features and benefits, it is important to consider its limitations. Being a commercial tool, PVS-Studio comes with a significant licensing cost, which might be a barrier for smaller teams or individual developers. Compared to some competitors offering wider language support, PVS-Studio's focus primarily remains on traditional compiled languages. Although its IDE integrations simplify usage, the initial setup for optimal configuration can be substantial, demanding some investment in time and effort.
In comparison to open-source alternatives like SonarQube or Cppcheck, PVS-Studio offers a more specialized and in-depth analysis, especially for C and C++. While open-source tools provide broader language coverage and cost-effectiveness, they might not match the depth and accuracy of PVS-Studio for specific languages. For instance, PVS-Studio excels in uncovering subtle memory management issues in C++ that more general-purpose analyzers might miss.
Implementation tips for PVS-Studio include configuring it early in the development lifecycle to maximize its benefits. Integrating it with your CI/CD pipeline allows for continuous code analysis, ensuring consistent code quality and early detection of potential issues. Leverage the detailed documentation and support resources to tailor the tool to your specific needs and coding practices.
PVS-Studio's website (https://pvs-studio.com) provides detailed information about licensing options and technical requirements. Potential users can explore trial versions to assess the tool’s capabilities and suitability for their specific projects. For teams working with large-scale C, C++, C#, or Java codebases, particularly in enterprise settings where code quality and security are critical, PVS-Studio offers a powerful and targeted solution for enhancing software reliability and minimizing risks. While the cost might be a factor, the investment can be justified by the potential savings in debugging time, improved code quality, and reduced security vulnerabilities in the long run, making PVS-Studio a valuable code analysis tool for demanding development environments.
10. RuboCop: Enforcing Ruby Style and Quality
RuboCop is a powerful, free, and open-source static code analyzer and formatter specifically designed for the Ruby programming language. It helps developers write cleaner, more consistent, and more maintainable Ruby code by enforcing the guidelines outlined in the community Ruby Style Guide. Whether you're a seasoned Rubyist or just starting out, RuboCop can be an invaluable tool for improving code quality and catching potential issues early in the development process, making it a worthy inclusion in any list of essential code analysis tools. Its automated formatting capabilities and extensive rule set make it an efficient way to enhance code readability and adherence to best practices, ultimately contributing to more robust and maintainable Ruby projects.
RuboCop’s core functionality revolves around its "cops," which are essentially rules that check for specific style and quality violations. With over 300 built-in cops, RuboCop provides comprehensive coverage of various aspects of Ruby code, from indentation and naming conventions to complex logic and potential bugs. These pre-defined rules cover a wide range of potential issues, ensuring adherence to established Ruby community standards and best practices. Furthermore, RuboCop doesn’t just identify issues; it often provides automatic code fixing suggestions and can even correct many violations automatically, saving developers valuable time and effort. This automated remediation feature streamlines the code cleanup process and encourages consistent code style throughout the project.
One of RuboCop's key strengths lies in its extensibility. Developers can create custom cops tailored to their specific project needs or coding standards. This allows teams to enforce unique style guidelines and ensure consistency across their codebase beyond the default Ruby Style Guide. This level of customization makes RuboCop highly adaptable to various project requirements and team preferences. Furthermore, RuboCop seamlessly integrates with popular IDEs and editors, providing real-time feedback and highlighting potential issues as you write code. This immediate feedback loop encourages developers to address problems proactively, preventing them from accumulating and becoming more difficult to fix later in the development cycle.
While RuboCop is a valuable tool for Ruby developers, it's important to be aware of its potential drawbacks. As a Ruby-specific tool, it’s not applicable to projects using other programming languages. While its strict adherence to style guidelines is generally beneficial, it can sometimes feel overly opinionated, leading to potential conflicts with individual coding preferences. Another consideration is that RuboCop can sometimes experience performance issues when analyzing very large codebases, which can impact developer productivity. Finally, configuring RuboCop for extensive customization can be complex, requiring a deeper understanding of its configuration options.
Practical Applications and Use Cases:
- Enforcing coding standards: RuboCop helps teams maintain consistent code style and quality across projects, regardless of the number of developers involved.
- Automating code formatting: RuboCop’s auto-correction capabilities significantly reduce the time spent on manual code formatting.
- Improving code readability: By enforcing style guidelines, RuboCop makes Ruby code easier to read and understand.
- Catching potential bugs early: Some of RuboCop’s cops can detect potential runtime errors or code smells, helping developers address these issues before they become major problems.
- Integrating with CI/CD pipelines: RuboCop can be integrated into continuous integration and continuous deployment pipelines to ensure code quality checks are performed automatically.
Comparison with Similar Tools:
While RuboCop is specifically designed for Ruby, other code analysis tools cater to different programming languages or offer broader functionalities. For example, SonarQube is a language-agnostic platform offering static code analysis for various languages, including Ruby. However, for Ruby-specific projects, RuboCop's in-depth understanding of the language and its ecosystem often makes it a more targeted and efficient choice.
Implementation and Setup Tips:
Installing RuboCop is straightforward, usually done via the command gem install rubocop. It can then be run from the command line within a project directory. A configuration file (.rubocop.yml) can be used to customize the rules and behavior of RuboCop.
Pricing and Technical Requirements:
RuboCop is free and open-source, requiring only a Ruby installation.
Website: https://rubocop.org
In conclusion, RuboCop is a valuable code analysis tool for Ruby developers, enabling them to write cleaner, more consistent, and more maintainable code. Its comprehensive rule set, automated formatting capabilities, and extensibility make it a powerful addition to any Ruby development workflow. While it has some limitations, its benefits in enforcing coding standards and improving code quality make it a worthwhile investment for any Ruby project. Its inclusion in this list of essential code analysis tools is well-deserved.
Top 10 Code Analysis Tools Comparison
| Tool | Core Features & Language Support | User Experience & Quality ★★★★☆ | Value Proposition & Pricing 💰 | Target Audience 👥 | Unique Selling Points ✨ |
|---|---|---|---|---|---|
| SonarQube | 25+ langs, CI/CD, security & debt analysis | Detailed reports, community & enterprise ★★★★☆ | Free community; pricey enterprise | Dev teams needing broad lang & security | Real-time gates, OWASP compliance 🏆 |
| CodeClimate | Multi-lang, maintainability, test coverage, PR integration | Clean UI, strong Git integration ★★★★☆ | Subscription-based, enterprise focused | Agile teams, repo maintainers 👥 | Technical debt quantification, velocity metrics |
| ESLint | JS/TS specific, highly configurable, auto-fix | Fast, real-time IDE feedback ★★★★★ | Free & open source | JS/TS devs needing code consistency 👥 | Large plugin ecosystem, auto-fix ✨ |
| Checkmarx SAST | 25+ langs, security focus, SDLC integration | Enterprise-grade, complex setup ★★★★☆ | High licensing cost | Security teams at large enterprises 👥 | Low false positives, compliance reporting 🏆 |
| Veracode Static Analysis | Binary/source scan w/o code, policy-based, API-first | Developer-friendly reports ★★★★☆ | Premium pricing, cloud-only | Enterprises needing source-free scans 👥 | No source code sharing needed ✨ |
| SpotBugs | Java bytecode bug detection, IDE/build integration | Effective Java bug detection ★★★★☆ | Free & open source | Java developers focusing on bug fixing 👥 | 400+ bug patterns, easy build integration |
| Pylint | Python-only, PEP8, configurable rules | Detailed reports but verbose ★★★☆☆ | Free & open source | Python devs enforcing style & standards 👥 | PEP8 compliance, CI/CD integration |
| CodeGuru Reviewer | ML-powered, Java & Python, AWS integration | Pay-per-use, no infra needed ★★★☆☆ | Pay-per-use, cloud/AWS dependent | AWS users, Java/Python devs 👥 | ML automated reviews, AWS ecosystem ✨ |
| PVS-Studio | C/C++/C#/Java static analysis, low false positives | Accurate enterprise usage ★★★★☆ | Commercial license, costly | Enterprise C-family devs 👥 | Advanced dataflow & incremental analysis 🏆 |
| RuboCop | Ruby style guide, auto-format, extensible | Ruby-specific, auto-fixing ★★★★☆ | Free & open source | Ruby developers & teams 👥 | Automatic formatting, 300+ cops rules ✨ |
Level Up Your Workflow: Combining Code Analysis with TreeSnap
From SonarQube's comprehensive analysis to Pylint's Python-specific checks and the powerful security-focused scans of Checkmarx and Veracode, the array of code analysis tools covered in this article provides a robust toolkit for any development team. Choosing the right tool depends heavily on your specific needs, whether it's identifying bugs, enforcing coding standards, or ensuring robust security. Consider factors like language support, integration with your existing CI/CD pipeline, the level of customization offered, and the type of analysis you require (static, dynamic, etc.) when making your decision. Implementing these tools effectively also requires careful configuration and ongoing monitoring to maximize their benefits and minimize false positives.
One crucial aspect of successful software development is clear and accurate documentation. After using code analysis tools to refine your code, ensure your documentation and other written materials are polished with a comprehensive proofreading checklist from Shy Editor. This will help ensure your project's documentation is as well-crafted as your code.
Beyond traditional code analysis, preparing your codebase for effective interaction with Large Language Models (LLMs) presents a new set of challenges. This is where TreeSnap comes into the picture. TreeSnap enhances your code analysis workflow by streamlining the process of preparing your code for AI interaction. By simplifying your repository into a manageable format for LLMs, TreeSnap complements the insights gained from code analysis tools, leading to more efficient debugging, refactoring, and documentation generation.
Ready to unlock the full potential of your code analysis process and harness the power of AI? Explore TreeSnap and transform your development workflow. TreeSnap seamlessly integrates with your code analysis tools, enabling you to efficiently prepare your repository for LLM interactions and further elevate code quality.